
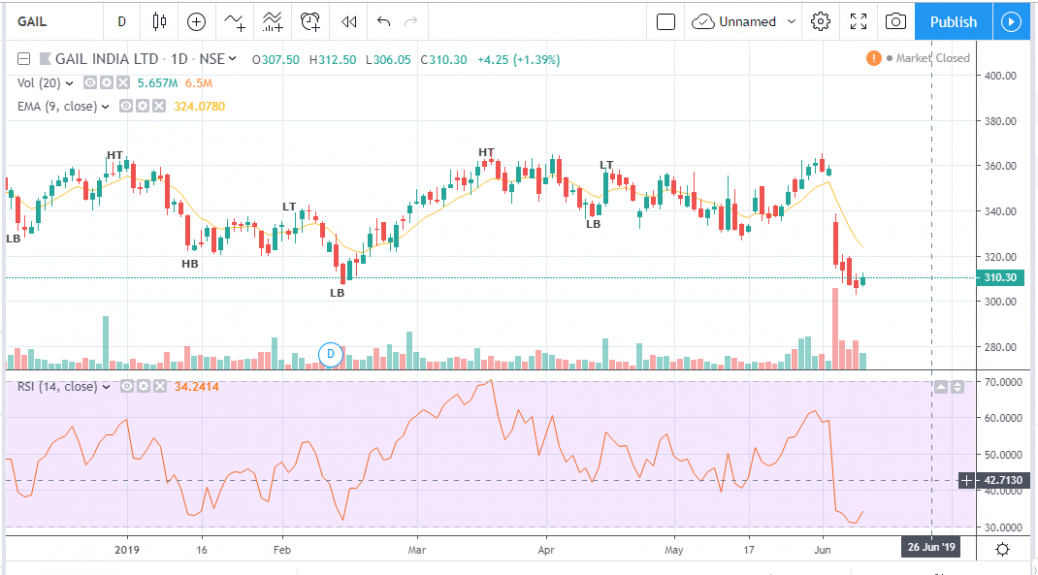
After a significant fall green candle opened by a gap up and sustained at the yesterdays closing price and indicators such as MA and RSI shows the possitive breakout.
—————————————————————————————–
Stock Ticker – NSE: NIFTY – NIFTY 50 – INDEX
Bullish Trade plan:
Entry Level 310 Target 320 Stoploss 300
Analyst Rating – :4/5
View Posted on 2019-06-12


Hi,
In the above chart we can see the breakout on 6th jun, a breakaway gap occurs when prices are breaking out of a range on significant volume, developing a new trend and the gap generally does not fill in near term. ( Moving average is also in negative sign please check)