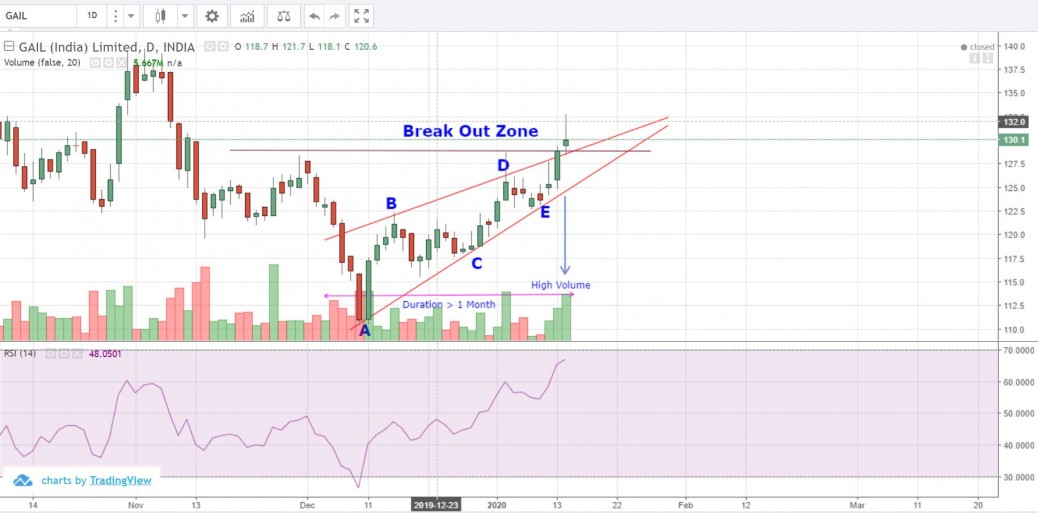
Triangle Pattern formation indicating bullish breakout suitable to create long postions.—————————————————————————————–
Stock Ticker – NSE: GAIL – GAIL (India) Ltd. – ENERGY
Bullish Trade plan:
Entry Level 130 Target 140 Stoploss 120
Analyst Rating – :4/5
View Posted on 2020-01-15
GAIL-01-14-2020-Triangle Pattern
feel free to call us +919500077790 info@eqsis.com
Stock Analysis
M | T | W | T | F | S | S |
---|---|---|---|---|---|---|
1 | 2 | 3 | 4 | 5 | 6 | 7 |
8 | 9 | 10 | 11 | 12 | 13 | 14 |
15 | 16 | 17 | 18 | 19 | 20 | 21 |
22 | 23 | 24 | 25 | 26 | 27 | 28 |
29 | 30 |
Bullish View
Bearish View
- Bearish-GAP-SHORT-BICON-25-10-2019 October 25, 2019
- FEDERAL BANK – BEARISH ENGULFING October 17, 2019
- Cummins India – Bearish Engulfing – 24Sep19 September 25, 2019
- Day29-Tata Motors DVR – Bearish Piercing – 12Sep19 September 12, 2019
- Day27-Bearish-Engulfing pattern-Tech Mahindtra-09Sep19 September 10, 2019
How this forum help stock traders?
Stock Trading is business, the success depends not just on capital or subscribing advisory services or participating workshops. The factors such as your awareness level about business, Efforts and your contributions, Smartness, Knowledge in analysis and trading instrument, availability of infrastructure and emotional control determine your success.
Hi,
The triangle area should be a minimum 1.5 months.
Noted Naresh