
Company: CIPLA Limited, a Pharma company.
Type of Chart: Candlestick.
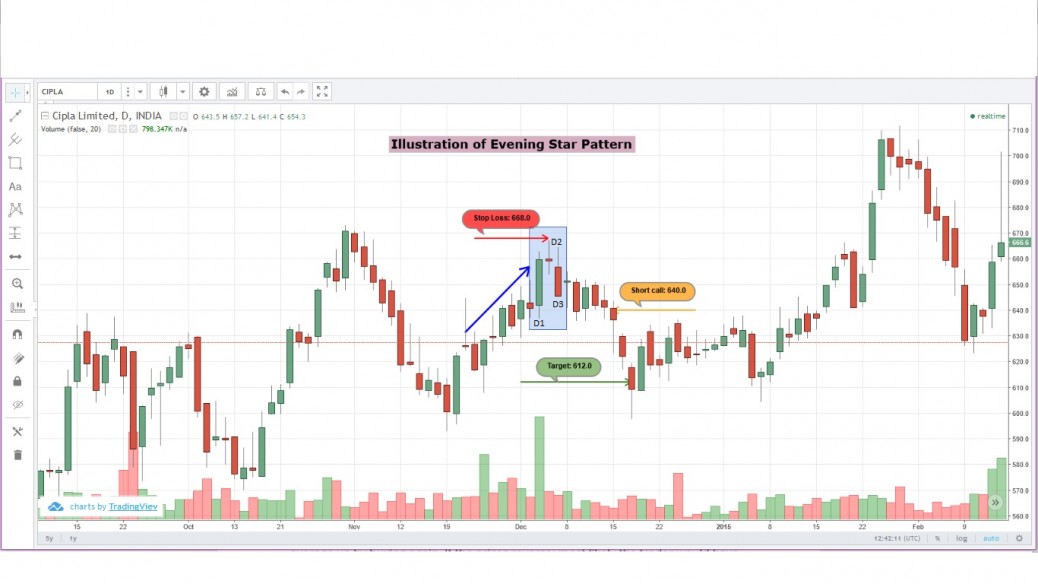
Evening Star is an indicative trend reversal pattern to be analysed with consecutive 3 days price behaviour pattern. During successive up trend, a noticeable Doji or Doji like candle ( ‘+’ like pattern) appears at the end of trend. This can be Doji or candle with small body having almost equal shadows on either side demonstrating equal strength from both Demand and supply side. Two other candles on either side are also included in the analysis.
Enclosed chart depicts one such pattern:
*Among these three candles first candle (D1) has usually Bullish candle large in size supported by high volume demonstrating strong control at supply zone. Closing price of this candle is at very high level.
*Next candle (D2) opens price at higher than previous days’(D1) closing price confirming continuance of Bulls control. The price moves up & down and finally settles down just below the opening price. Peak high & Low are at equidistance from the candle body. Here, both supply & demand are strong, but indecisive to further trend.
*Third candle (D3) price opens below the closing level of previous D2 candle and moves downward due to weakening buying pressure forming RED candle. In fact, a jump down is seen while opening price and manages to cover over 50% of bullish candle body(D1). This behaviour confirms Bears regaining control and it is expected to continue in the same direction.
The Star’+’ candle appears signalling downtrend, it called “Evening Star”.


