
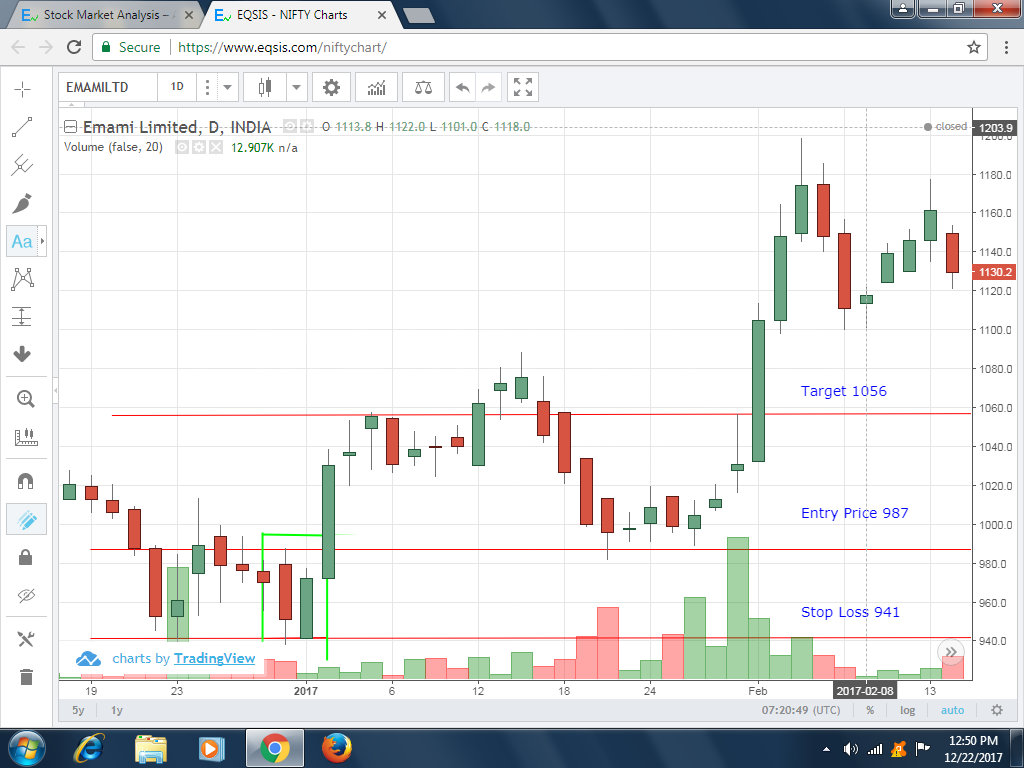
In this Emami Limited Chart, the second day green candle’ body covered the Previous Day’s Low. And today’s body should cover atleast 50% mark of previous Body. The upper tail is small in size. The first candle’s high price is the entry price. The second candle’s close price is the stop loss and the target is in 1:1.5 ratio.
The target achieved in 3 days.


Hi sir,
it is a good example for bullish piercing pattern.
Thank for your comment.