
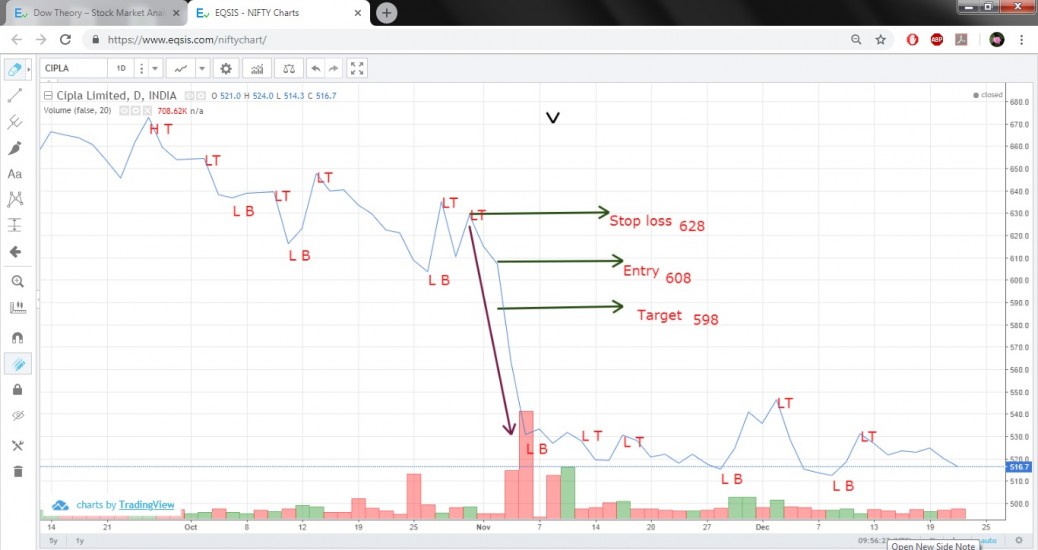
Dow theory gives positional traders a grasp on the trend of the market. If a lower top and lower bottom are in a sequence then it is time to take a short position. It is the way to make friends with the Bear.
feel free to call us +919500077790 info@eqsis.com
Dow theory gives positional traders a grasp on the trend of the market. If a lower top and lower bottom are in a sequence then it is time to take a short position. It is the way to make friends with the Bear.
| M | T | W | T | F | S | S |
|---|---|---|---|---|---|---|
| 1 | 2 | 3 | 4 | 5 | 6 | 7 |
| 8 | 9 | 10 | 11 | 12 | 13 | 14 |
| 15 | 16 | 17 | 18 | 19 | 20 | 21 |
| 22 | 23 | 24 | 25 | 26 | 27 | 28 |
| 29 | 30 | |||||
 Bearish-GAP-SHORT-BICON-25-10-2019 October 25, 2019
 FEDERAL BANK – BEARISH ENGULFING October 17, 2019
 Cummins India – Bearish Engulfing – 24Sep19 September 25, 2019
 Day29-Tata Motors DVR – Bearish Piercing – 12Sep19 September 12, 2019
 Day27-Bearish-Engulfing pattern-Tech Mahindtra-09Sep19 September 10, 2019
Stock Trading is business, the success depends not just on capital or subscribing advisory services or participating workshops. The factors such as your awareness level about business, Efforts and your contributions, Smartness, Knowledge in analysis and trading instrument, availability of infrastructure and emotional control determine your success.
EQSIS, A Stock Market Research Firm
Knowledge is Power. Here you may start from basics, get support while practicing and evolve as active analyst, later you can become a pro


Hi,
The time between the two peaks is also a determining factor for the existence of a double top pattern so, duration between the two peak should be minimum 20 days. by the way, we appreciate your efforts in posting your views.
Hi,
Thank you for your comment. This is Dow theory bearish pattern. I don’t remember any concern for twin peaks here. I just thought the low top-low bottom sequence with a good volume was enough.
Maybe I have missed. Please clarify.