
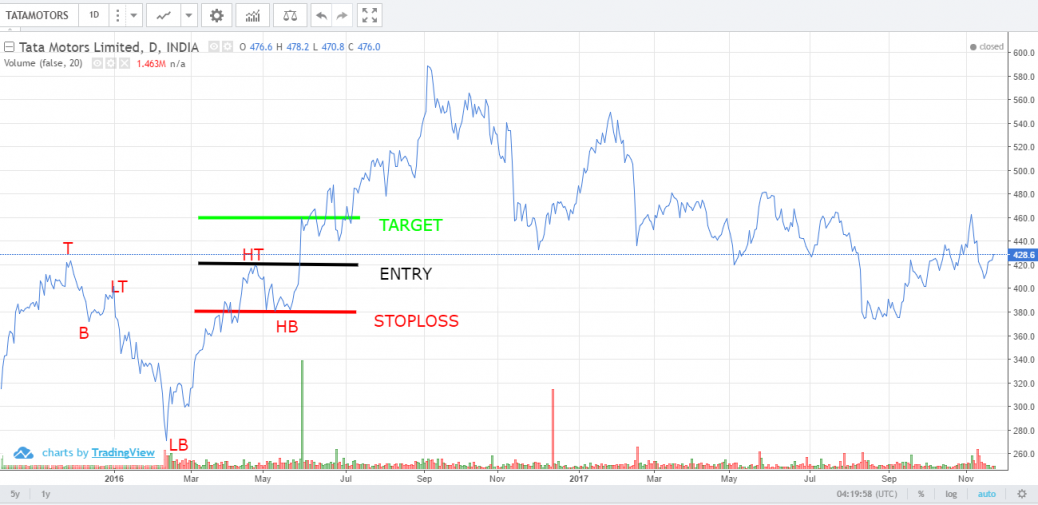
As per Dow Theory, Tata Motors witnessed a bearish pattern on the chart. It managed to break the previous high of 420. Also it was observed on the chart that it was making higher tops and higher bottoms. Their was a phenomenal rise in the volume as well. the entry point of the trade was 420 with target of 460 and stoploss of 380.
the target was achieved on next day


Good work sir.. Kindly mark the all qualified top and bottom in the chart. This helps us to gain experience at early period.