
Title : Double Top illustration – Finolex
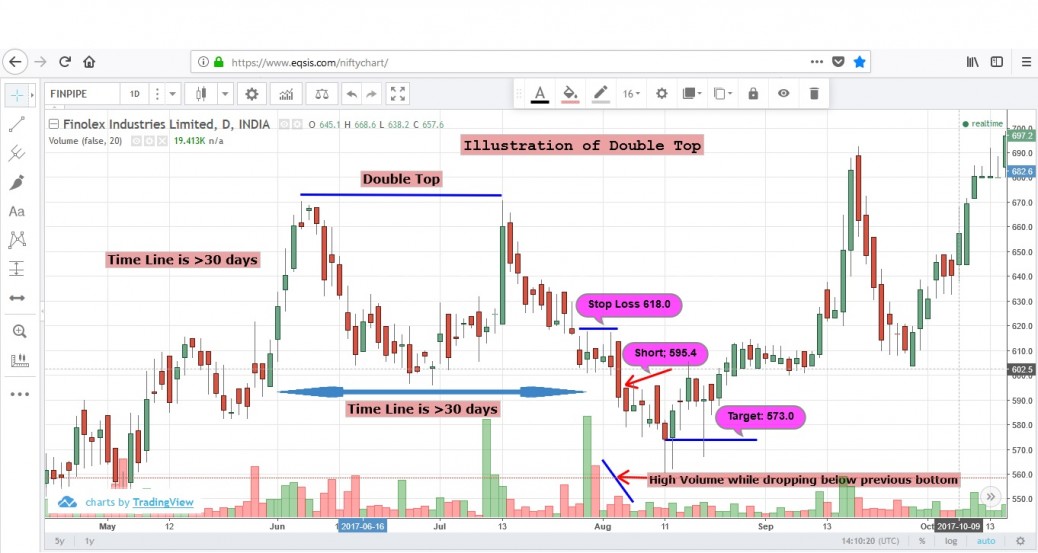
Company selected : Finolex Industries Ltd.,
Type of chart : Candlestick pattern
Illustration : Double Top characteristics.
The chart display Double Top with time interval of more 30 days. It is seen that prices moves persistently towards peak with good volumes. However, at Supply zone’s strong resistance is seen and subsequent weakening of buying power resulting downward movements of price. While reaching previous bottom level, due to successive high volume of selling pressure, the price further dropped down. This price behaviour pattern complies to Dow’s theory of Demand & Supply.
Normal
0
false
false
false
EN-IN
X-NONE
X-NONE


