
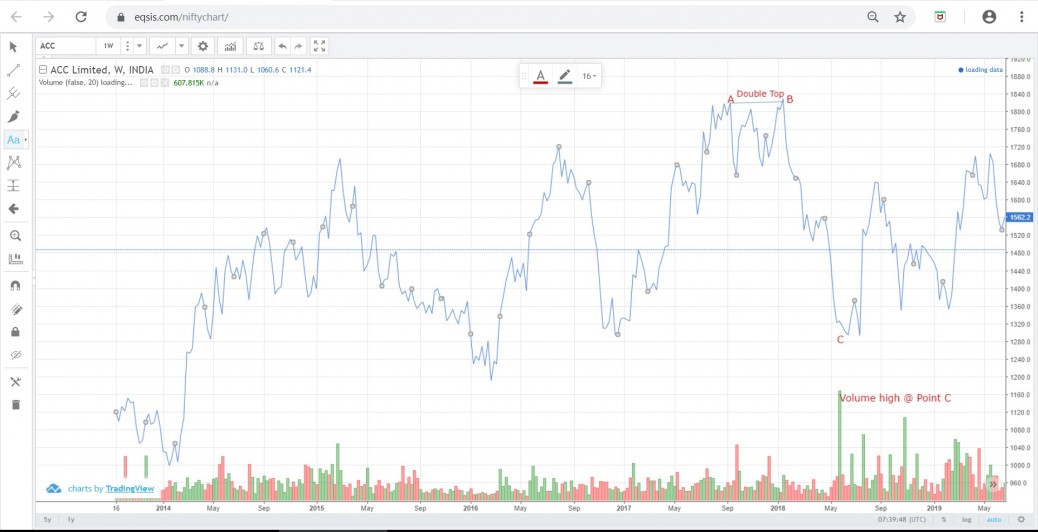
ACC Ltd Double top chart Attached
It was Found between Sep’18
Volume is high @ Point C so short positions can be considered.
feel free to call us +919500077790 info@eqsis.com
ACC Ltd Double top chart Attached
It was Found between Sep’18
Volume is high @ Point C so short positions can be considered.
| M | T | W | T | F | S | S |
|---|---|---|---|---|---|---|
| 1 | 2 | 3 | 4 | 5 | 6 | 7 |
| 8 | 9 | 10 | 11 | 12 | 13 | 14 |
| 15 | 16 | 17 | 18 | 19 | 20 | 21 |
| 22 | 23 | 24 | 25 | 26 | 27 | 28 |
| 29 | 30 | |||||
 Bearish-GAP-SHORT-BICON-25-10-2019 October 25, 2019
 FEDERAL BANK – BEARISH ENGULFING October 17, 2019
 Cummins India – Bearish Engulfing – 24Sep19 September 25, 2019
 Day29-Tata Motors DVR – Bearish Piercing – 12Sep19 September 12, 2019
 Day27-Bearish-Engulfing pattern-Tech Mahindtra-09Sep19 September 10, 2019
Stock Trading is business, the success depends not just on capital or subscribing advisory services or participating workshops. The factors such as your awareness level about business, Efforts and your contributions, Smartness, Knowledge in analysis and trading instrument, availability of infrastructure and emotional control determine your success.
EQSIS, A Stock Market Research Firm
Knowledge is Power. Here you may start from basics, get support while practicing and evolve as active analyst, later you can become a pro


Hi,
Good spot… the price level at both these peaks represents a key level of resistance. In the above chart point, A and point B is absolutely right but we need to discuss about point C… You can easily find the trade levels just follow the instructions …. First, draw the two horizontal lines; one should be above the two peaks across the top of the pattern, while another should be horizontally through the lowest price point along the bottom, where the price retraced.
A breakout to the downside below the bottom horizontal line is generally viewed as a sell signal, indicating a shorting opportunity(Note-Volume should be high during the breakout)