
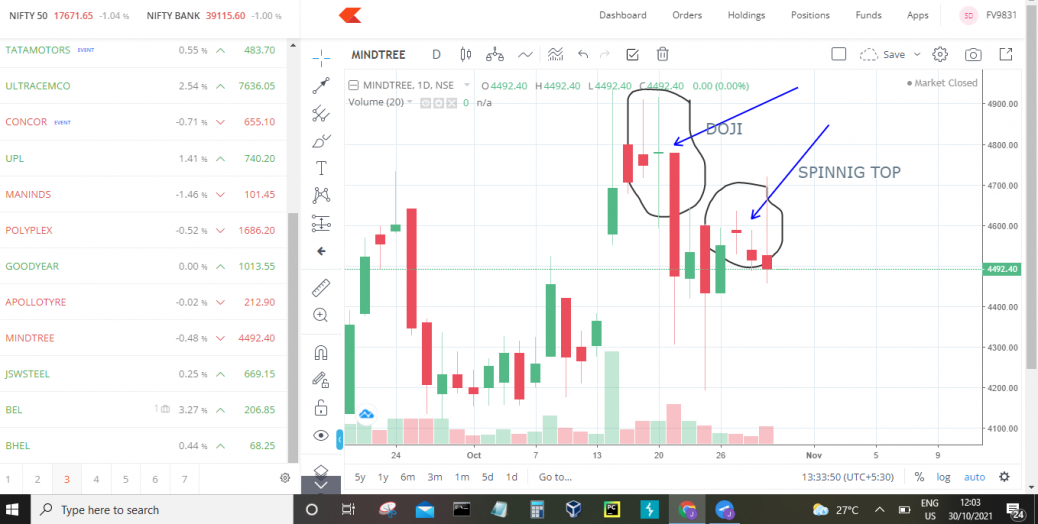
- A Doji is a candlestick pattern that looks like a cross as the opening price and the closing prices are equal or almost the same.
- When looked at in isolation, a Doji indicates that neither the buyers nor sellers are gaining – it’s a sign of indecision.
- my point of view is we cant build any trade plan with only reference of doji


Hi,
Volume should be high during the Doji day. (Note- A candlestick reversal pattern on high volume carries more weight than a candlestick reversal pattern on low volume so, volume plays a significant role in the buying and selling of the stocks)
noted with thanks