
Refer comments below
feel free to call us +919500077790 info@eqsis.com
Refer comments below
| M | T | W | T | F | S | S |
|---|---|---|---|---|---|---|
| 1 | 2 | 3 | 4 | 5 | ||
| 6 | 7 | 8 | 9 | 10 | 11 | 12 |
| 13 | 14 | 15 | 16 | 17 | 18 | 19 |
| 20 | 21 | 22 | 23 | 24 | 25 | 26 |
| 27 | 28 | 29 | 30 | 31 | ||
 Bearish-GAP-SHORT-BICON-25-10-2019 October 25, 2019
 FEDERAL BANK – BEARISH ENGULFING October 17, 2019
 Cummins India – Bearish Engulfing – 24Sep19 September 25, 2019
 Day29-Tata Motors DVR – Bearish Piercing – 12Sep19 September 12, 2019
 Day27-Bearish-Engulfing pattern-Tech Mahindtra-09Sep19 September 10, 2019
Stock Trading is business, the success depends not just on capital or subscribing advisory services or participating workshops. The factors such as your awareness level about business, Efforts and your contributions, Smartness, Knowledge in analysis and trading instrument, availability of infrastructure and emotional control determine your success.
EQSIS, A Stock Market Research Firm
Knowledge is Power. Here you may start from basics, get support while practicing and evolve as active analyst, later you can become a pro


Trade plan:
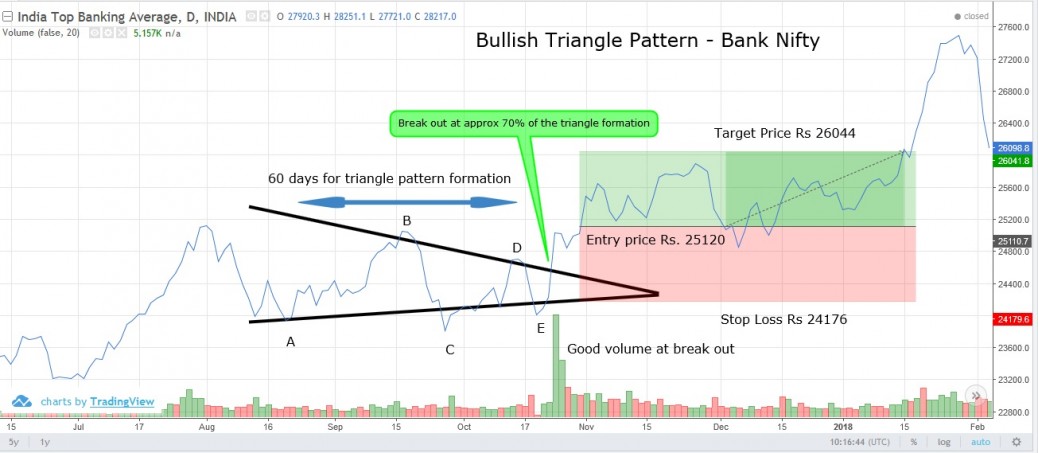
Triangle pattern is one of the strongest patterns to identify trend consolidation. It is characterized by a contraction in price range and converging trend-lines giving it a triangular shape.
Prior trend is bullish.
Conditions:
• Pattern formed in 60 days (Takes minimum 45 days to form)
• Spotted the 5 wave (A-B-C-D-E) structure where A is the bottom, B is the next top, C is the next bottom slightly higher than A and D is the next top that is slightly lower than B. This indicates that both buyers and sellers are active.
• Both top and bottoms trend-lines converging at E forms a triangle.
• Volume is high while giving breakout
• Upward breakout can be seen and hence long position created with risk reward ratio of 1:1 (One can wait for closing above break out point or closing below break down point for 2 days, to enter in strong trend, and stay away from fake breakout).
o Entry price: Rs 25120
o Stop loss: Rs 24176
o Target price: Rs 26044
• Note: The risk-reward here could always be much better than 1:1 as the stop loss can be based on the smallest portion of the triangle whereas profit booking point can be equal to the largest height of the triangle.