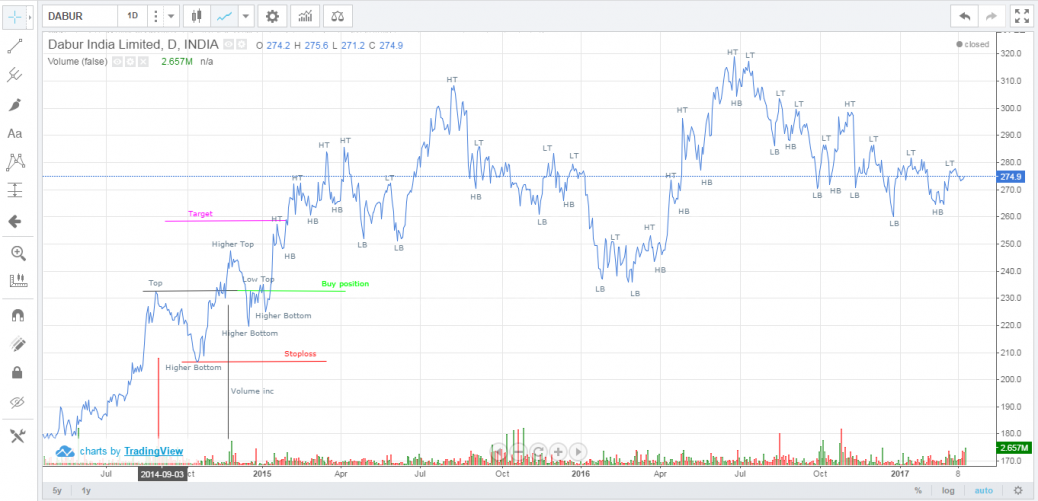
While analyzing the Dabur chart for Dow Theory i found a bullish pattern which satisfies the conditions such as Higher Bottom-Higher Top with increase in volume at the breakout.The overall duration of the trade came out to be 3 months since Dow Theory is used for long term trading.