
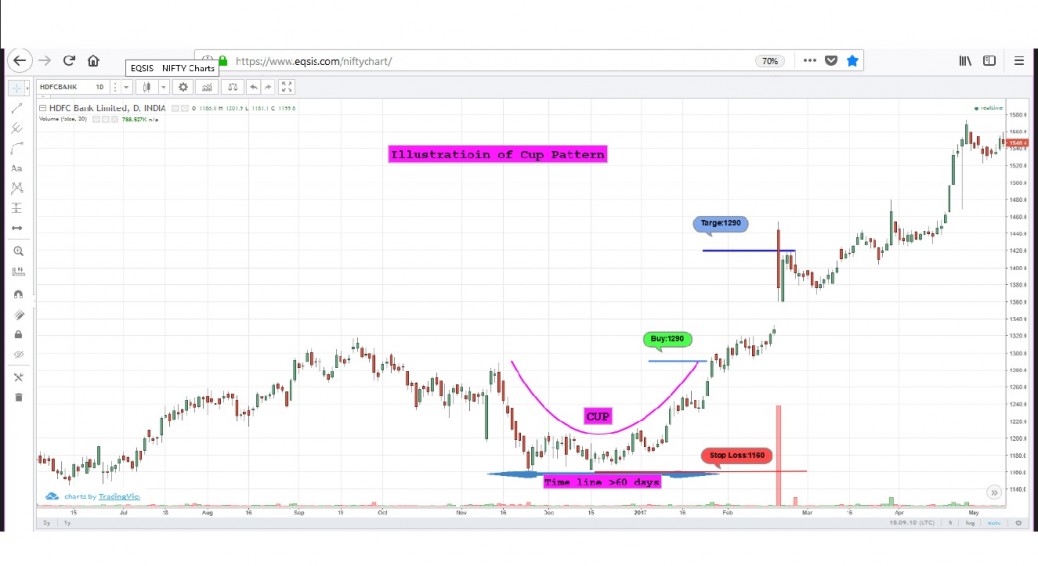
Type of Chart : Candle stick pattern
Company Chosen: HDFC Bank Ltd., a financial service provider.
Candle stick pattern is an accumulation pattern in characteristic. It accumulates the stocks slowly from the market and try to retain its position at Demand Zone. It is indifferent to any external price variation. Once the target accumulation is complete, gradually, of-load begins. Behaviour during this whole process, formation of pattern looks like Cup. Once CUP formation is competed, selling would start aggressively.
Similar behaviour can be seen in the enclosed chart. At the beginning of formation CUP, heavy selling is seen indicating stocks are getting accumulated with stronger hands like Institutional Investor, FII, FPI, etc. It sustains to hold the price for few days till buying power increases. Since the sizable stocks are accumulated, it shows no reaction or very little jerk reactions. Stock volumes are insignificant and hardly seen in the graph. Then gradually, the stock is being released in small quantities. As soon as CUP pattern completes, the prices shoots up in the same bullish direction. The momentum is so high that even “gap up” is also seen. The whole formation took more than 60 days complying to CUP pattern requirements.


