
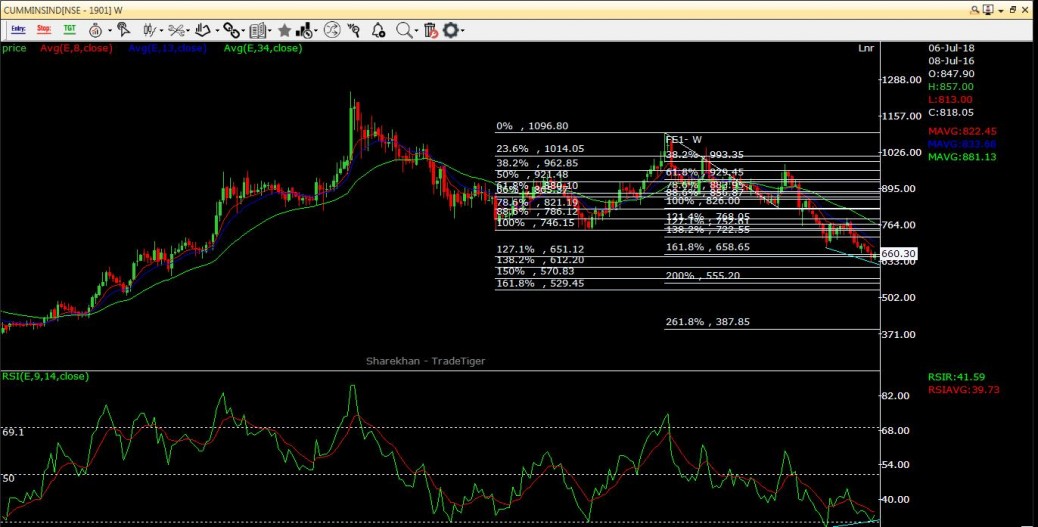
On weekly chart following are noticed:
1. 1.Bullish Harami candle pattern
2. 2.Positive divergence (Declining prices and improving technical: this is most powerful divergence since RSI did not go below 30.9)
3. 3.Fib.confluence at 161.8% extn.and 127.1% retracement


