
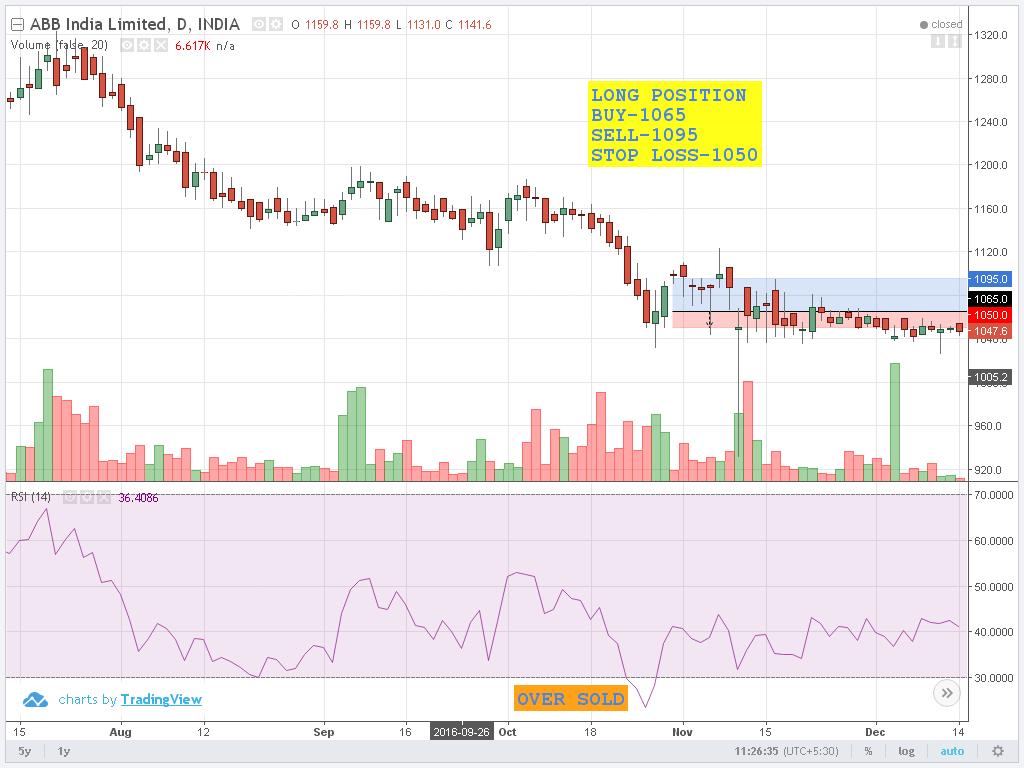
LONG POSITION BUY-1065 SELL-1095 STOP LOSS-1050
Relative Strength Indicator
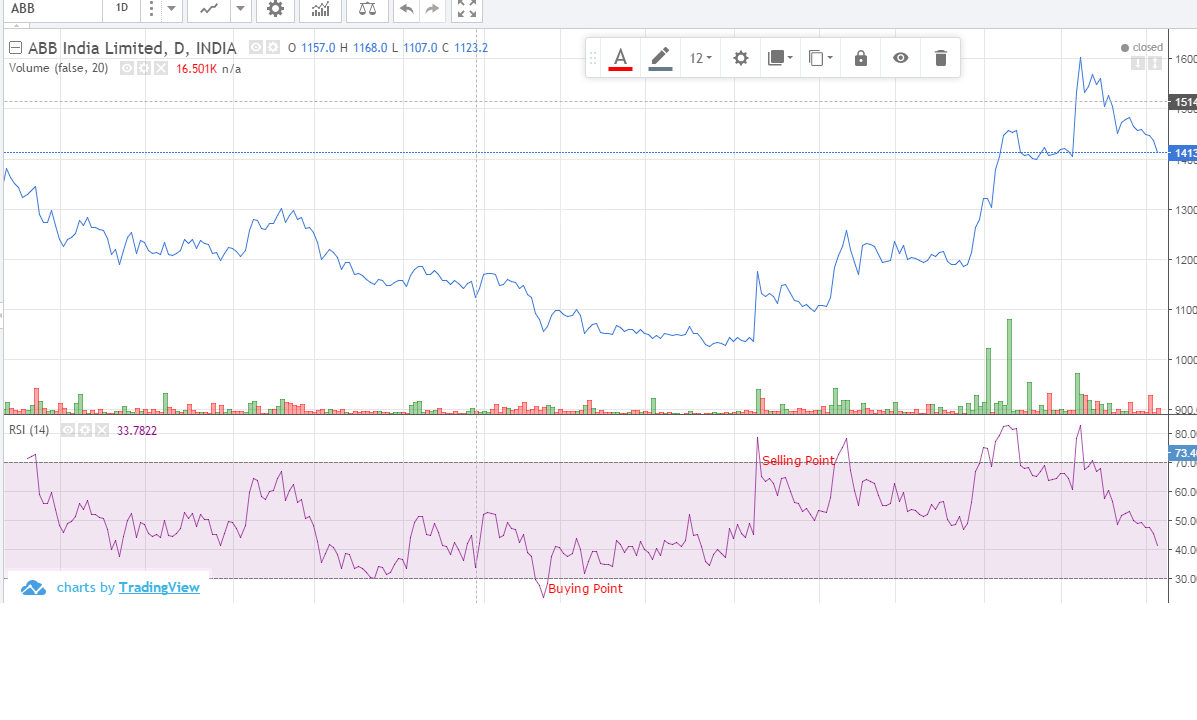
Symbol: ABB Direction: Bullish Entry Level: 1100 Stop Loss: 1050 Target: 1150
Enter if RSI index moves above 30 mark. Stop loss is set at previous Strong demand zone. Equivalent target is achieved.
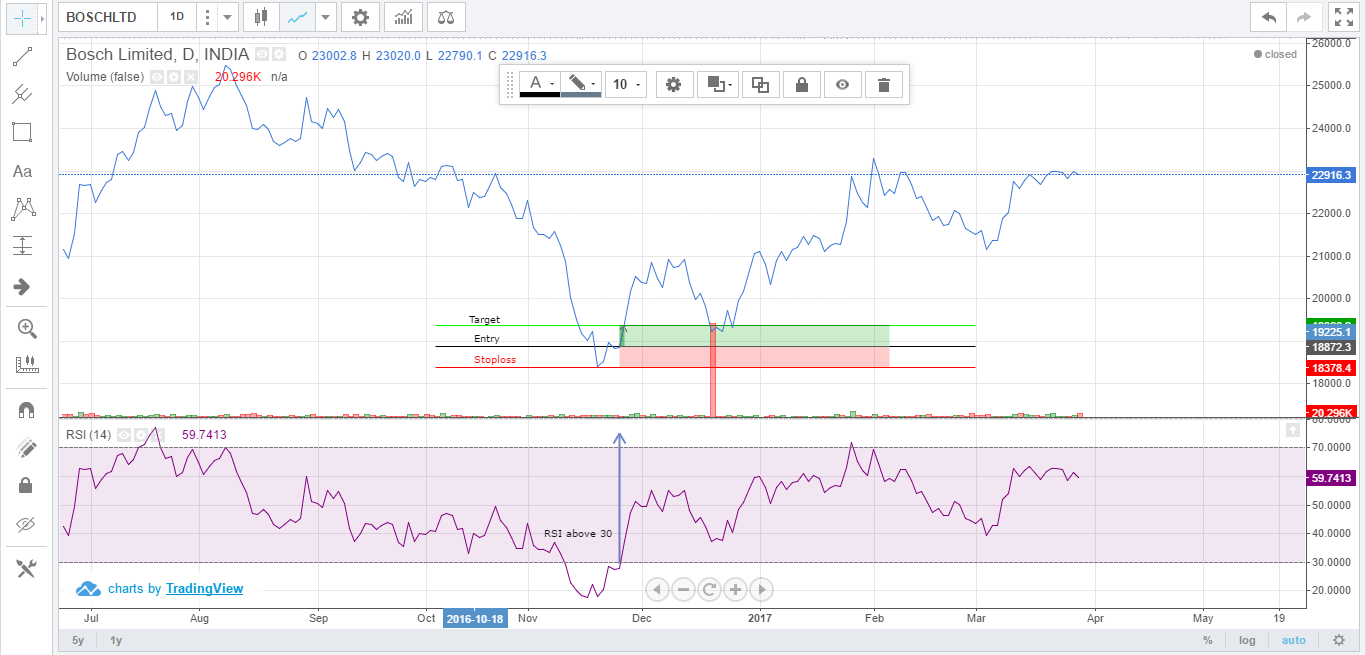
entry(buy)-18872.3 target(sell)-19366.2 stoploss-18378.4
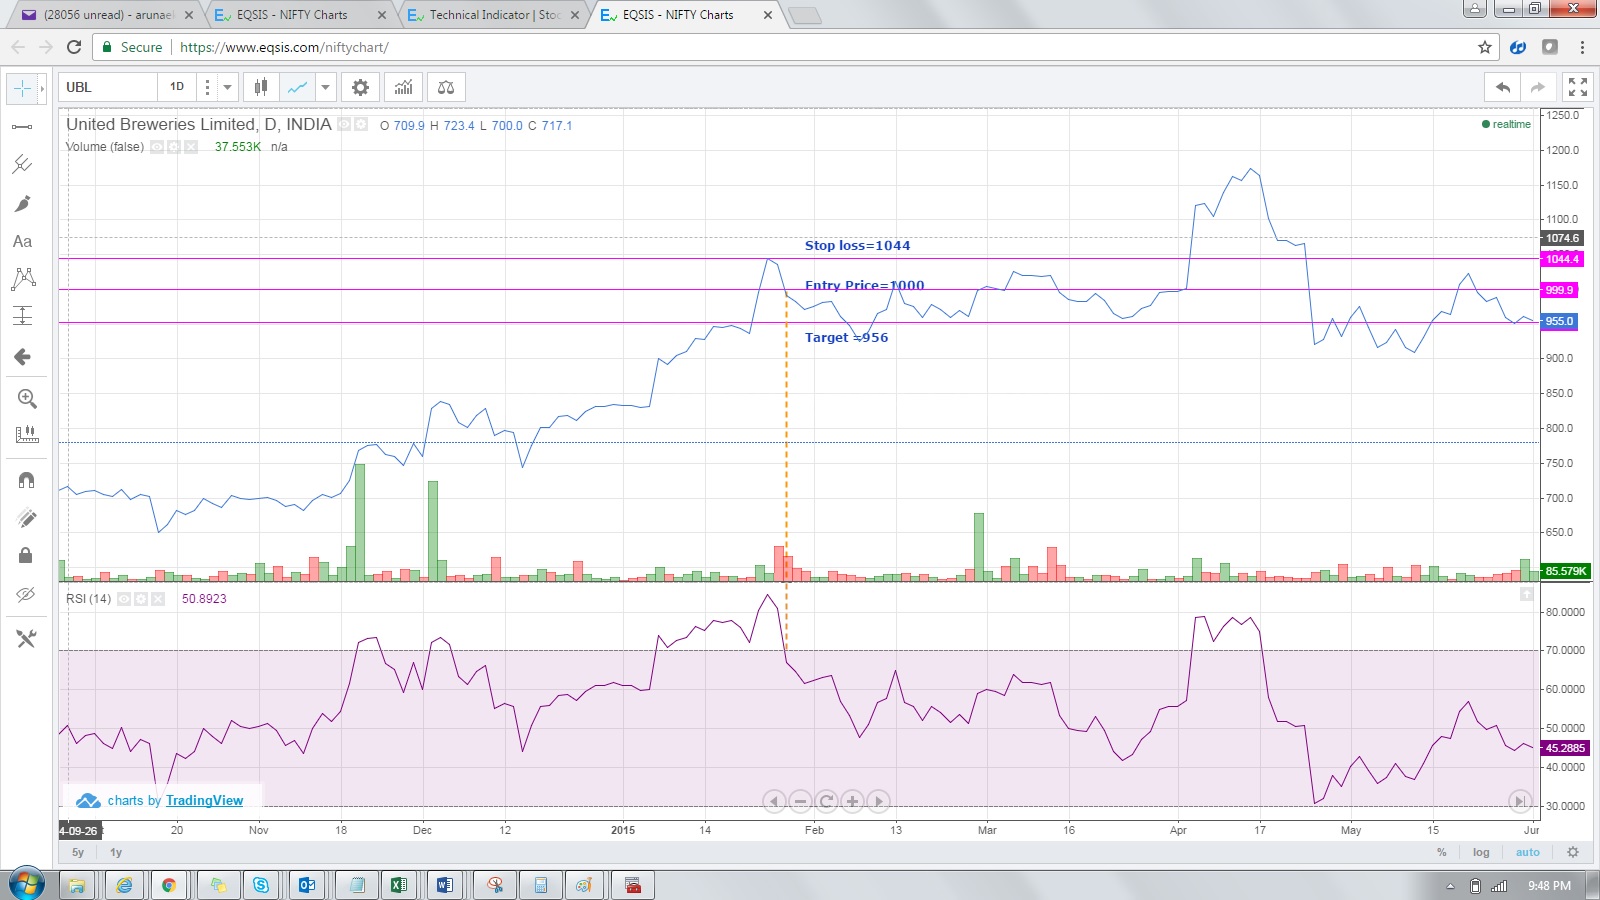
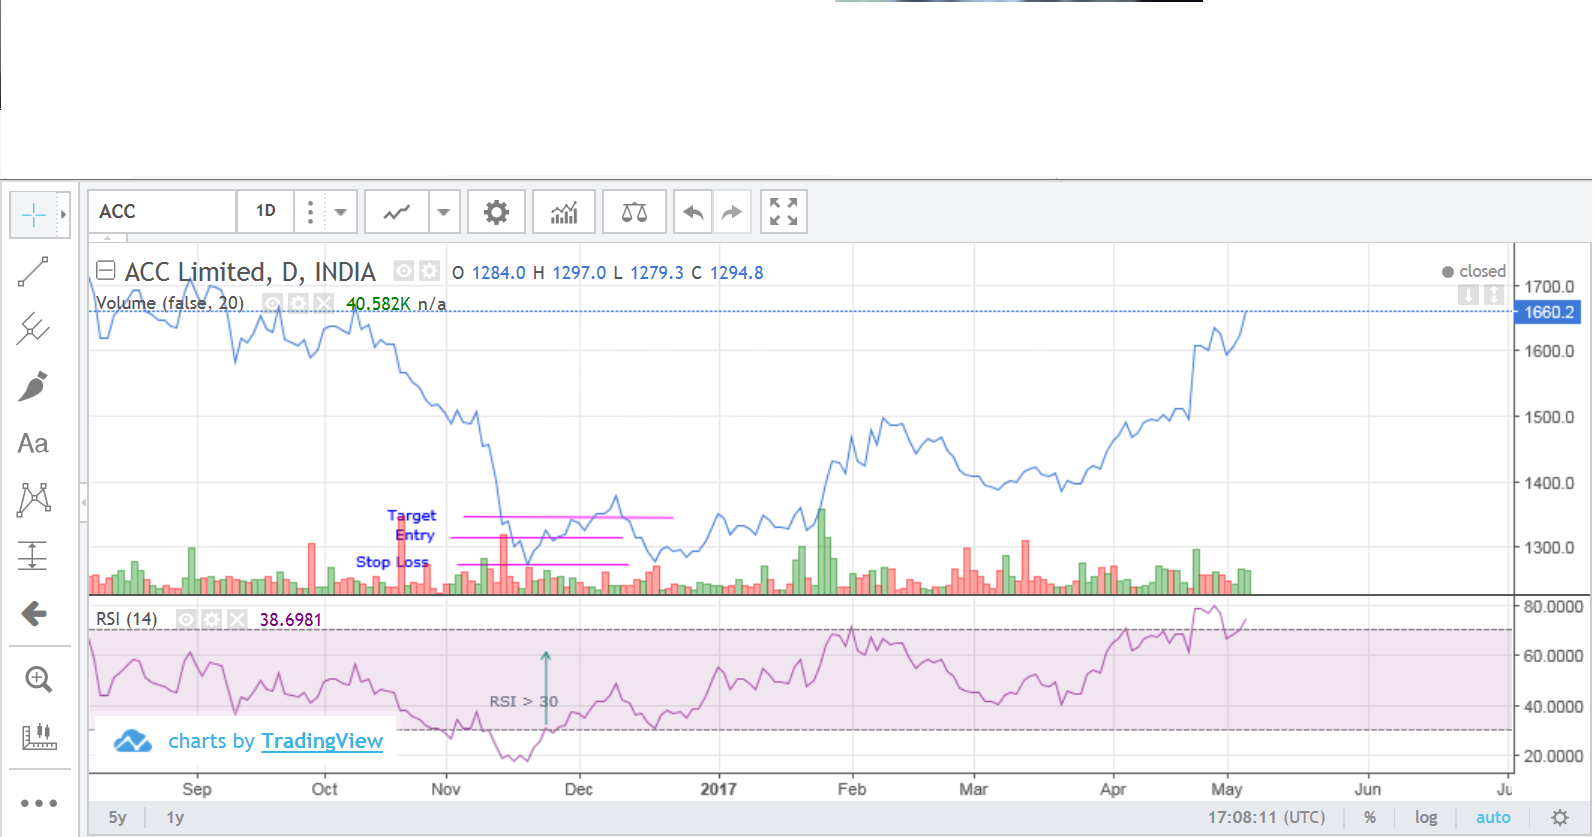
Entry Price=1000 Stop Loss=1044 Target=956 Duration=10 days
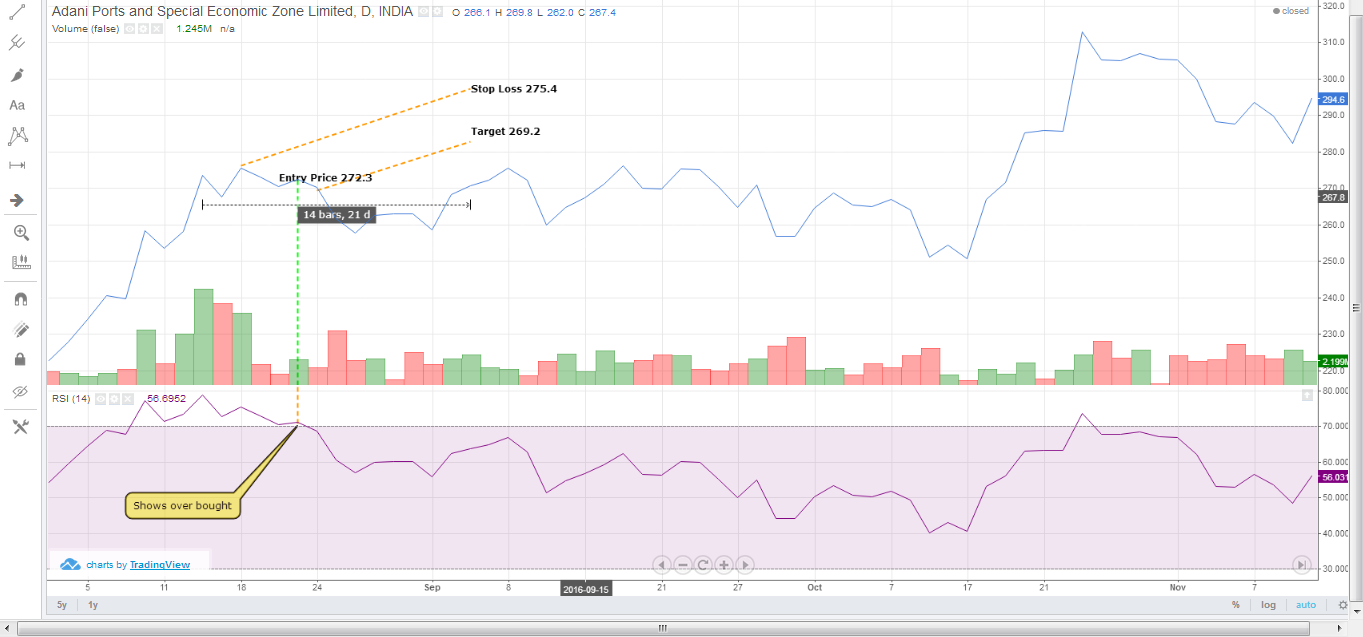
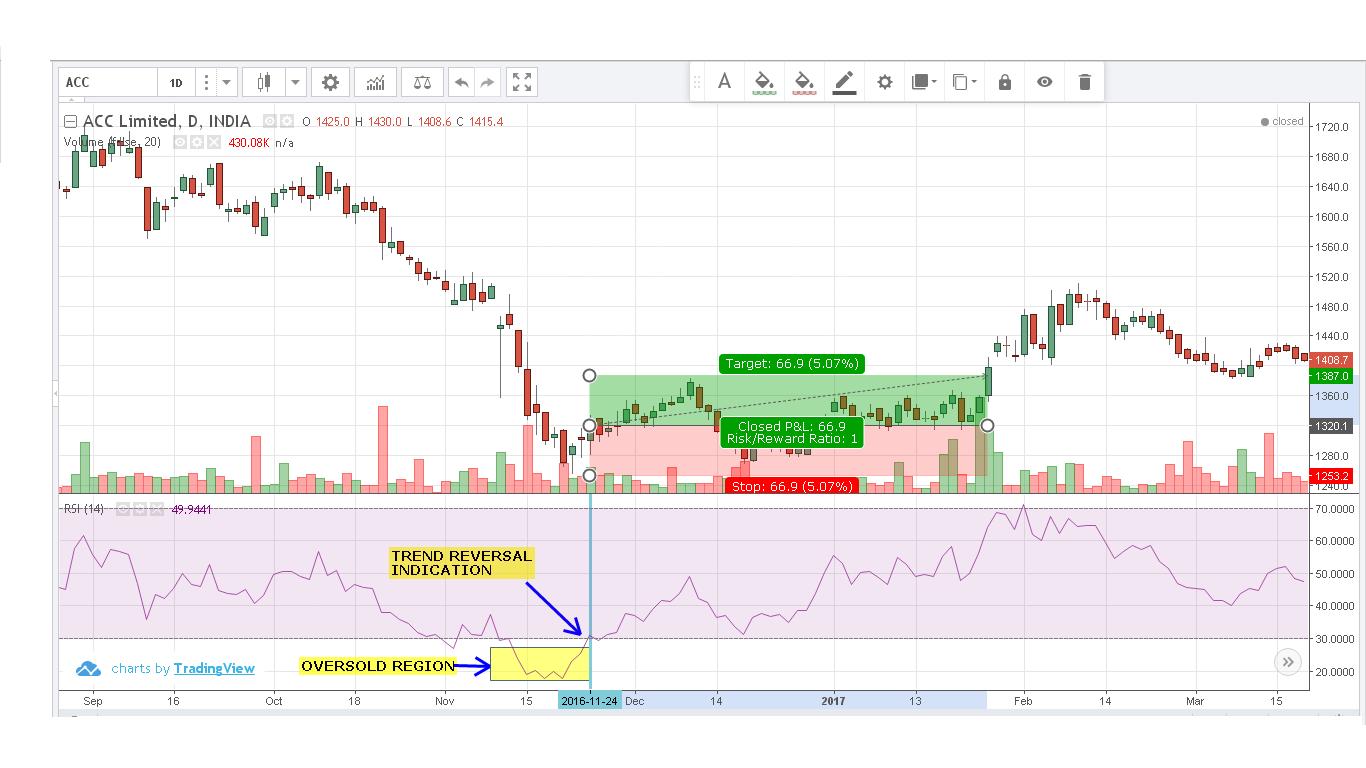
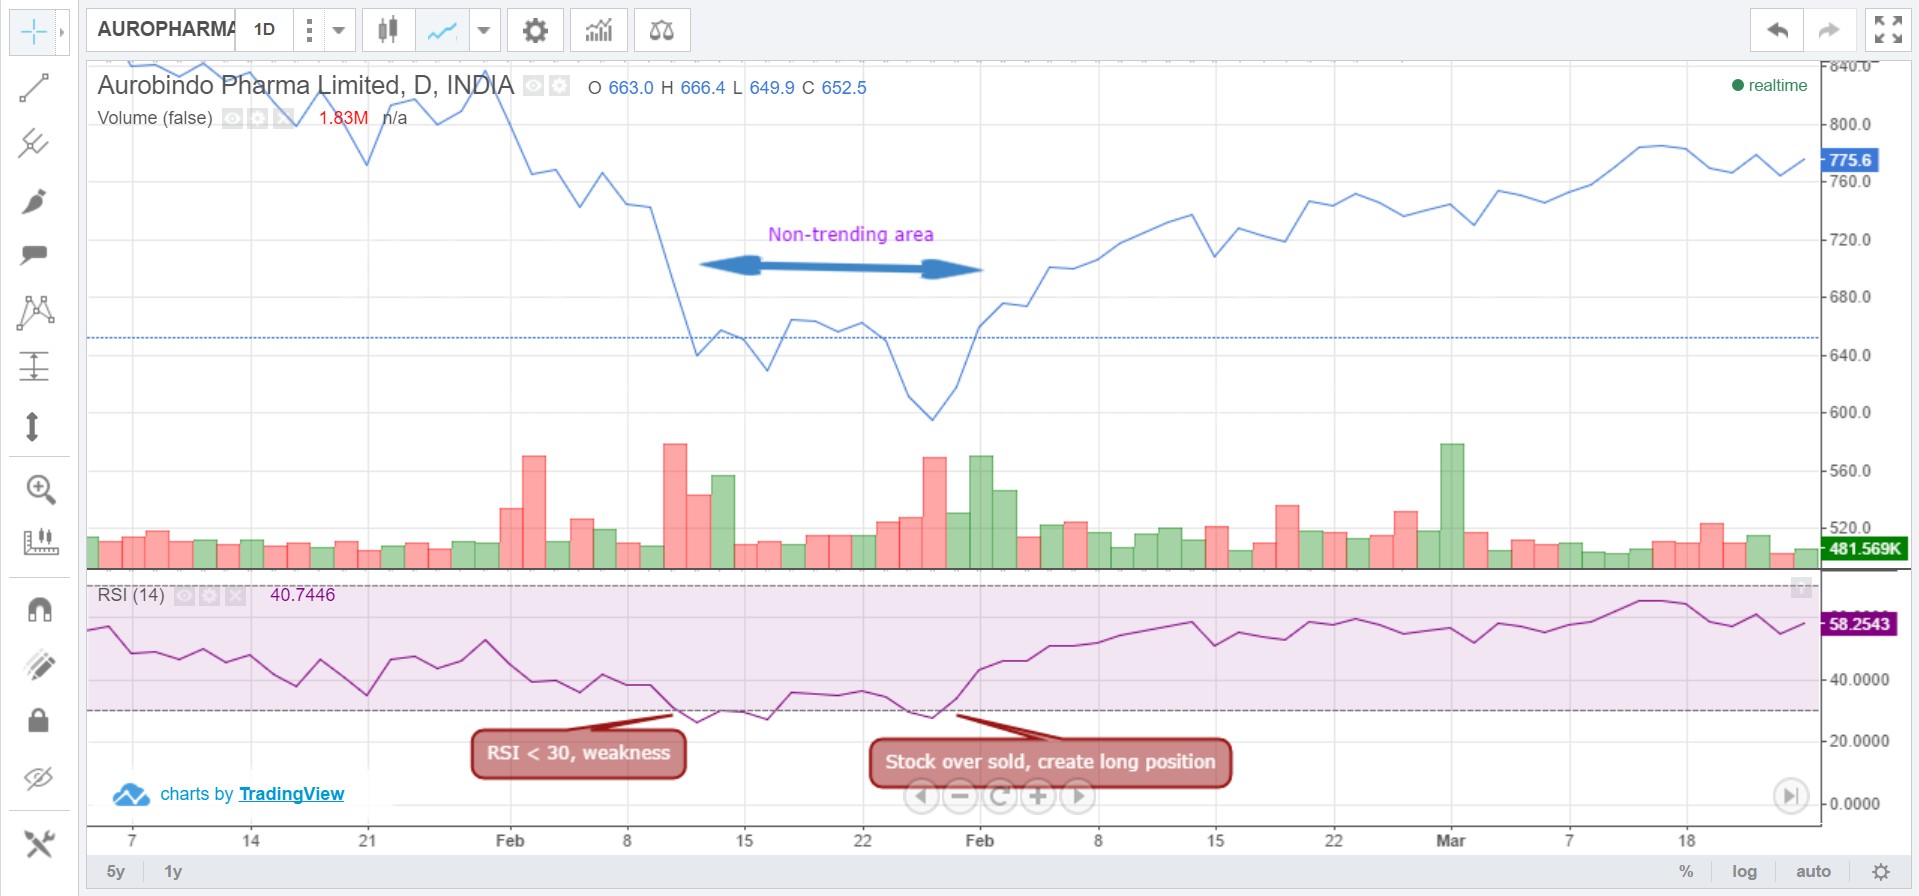
A RSI indicator is applied for the non-trending zone for min 21 days. The indicator shows that the stocks are...
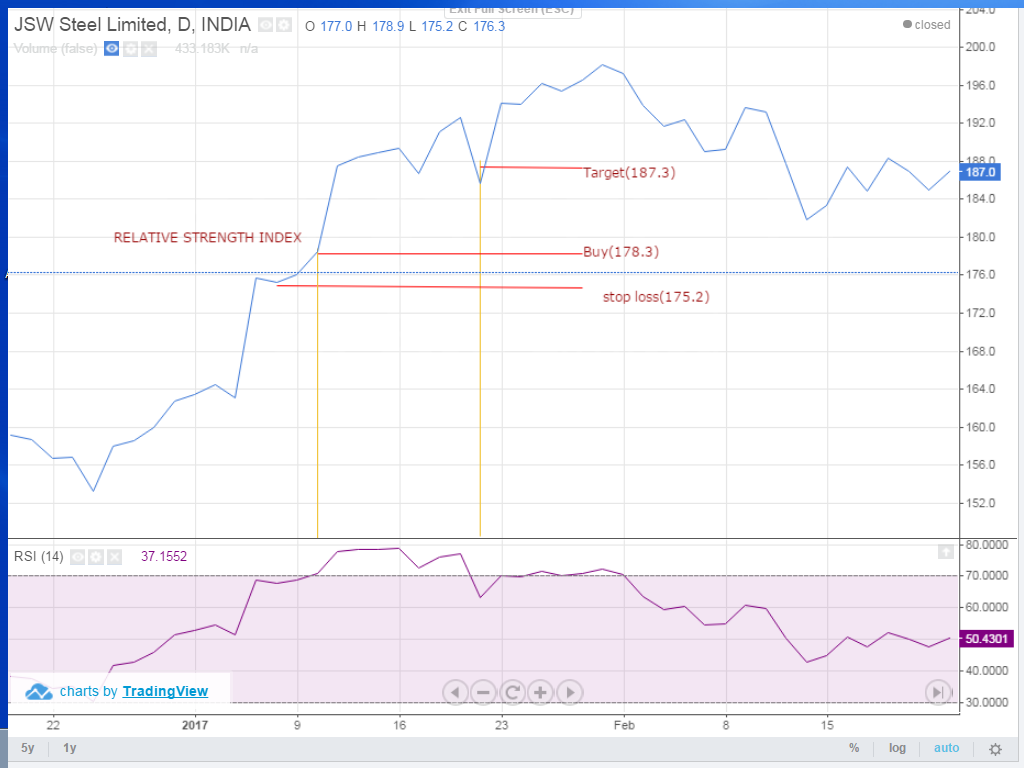
Long position BUY:178.3 SELL:187.3 STOP LOSS:175.2
Recently Active Members
Bullish View


Bearish View
-
 Bearish-GAP-SHORT-BICON-25-10-2019 October 25, 2019
-
 FEDERAL BANK – BEARISH ENGULFING October 17, 2019
-
 Cummins India – Bearish Engulfing – 24Sep19 September 25, 2019
-
 Day29-Tata Motors DVR – Bearish Piercing – 12Sep19 September 12, 2019
-
 Day27-Bearish-Engulfing pattern-Tech Mahindtra-09Sep19 September 10, 2019