
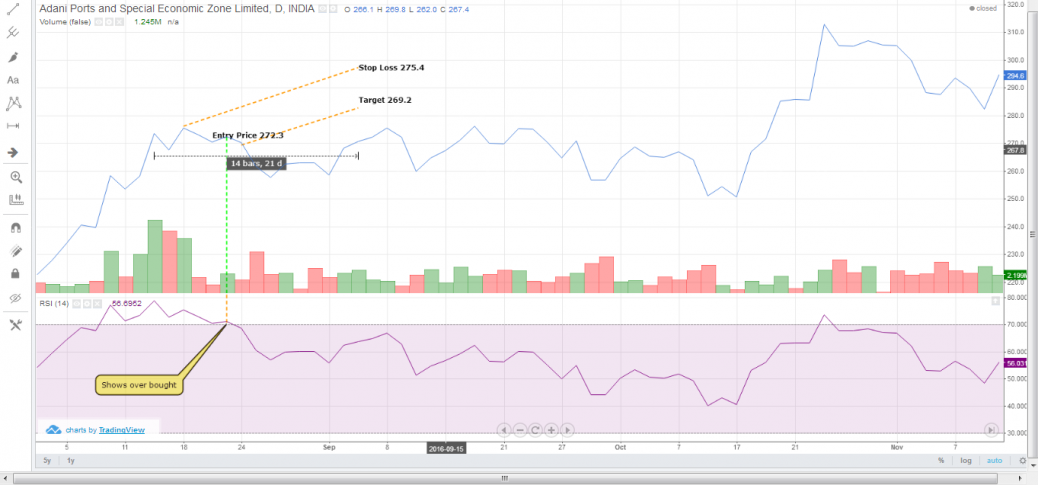
A RSI indicator is applied for the non-trending zone for min 21 days.
The indicator shows that the stocks are over bought hence tend to fall in price at the price at 272.3
The short position can be considered at this point and it’s price below with the risk as 3.1 whose target is reached in very next day that is 269.2
As like as Moving average, we can also expect RSI keeps price positive when it’s above 70 mark, and keeps it negative when it is below 30 mark. The subsequent attraction and repelling at each of this equilibrium shows that the trend is expected to be reversal.


good descriptive analysis
Thank you Tamil Selvam..