
volume raising
Relative Strength Indicator
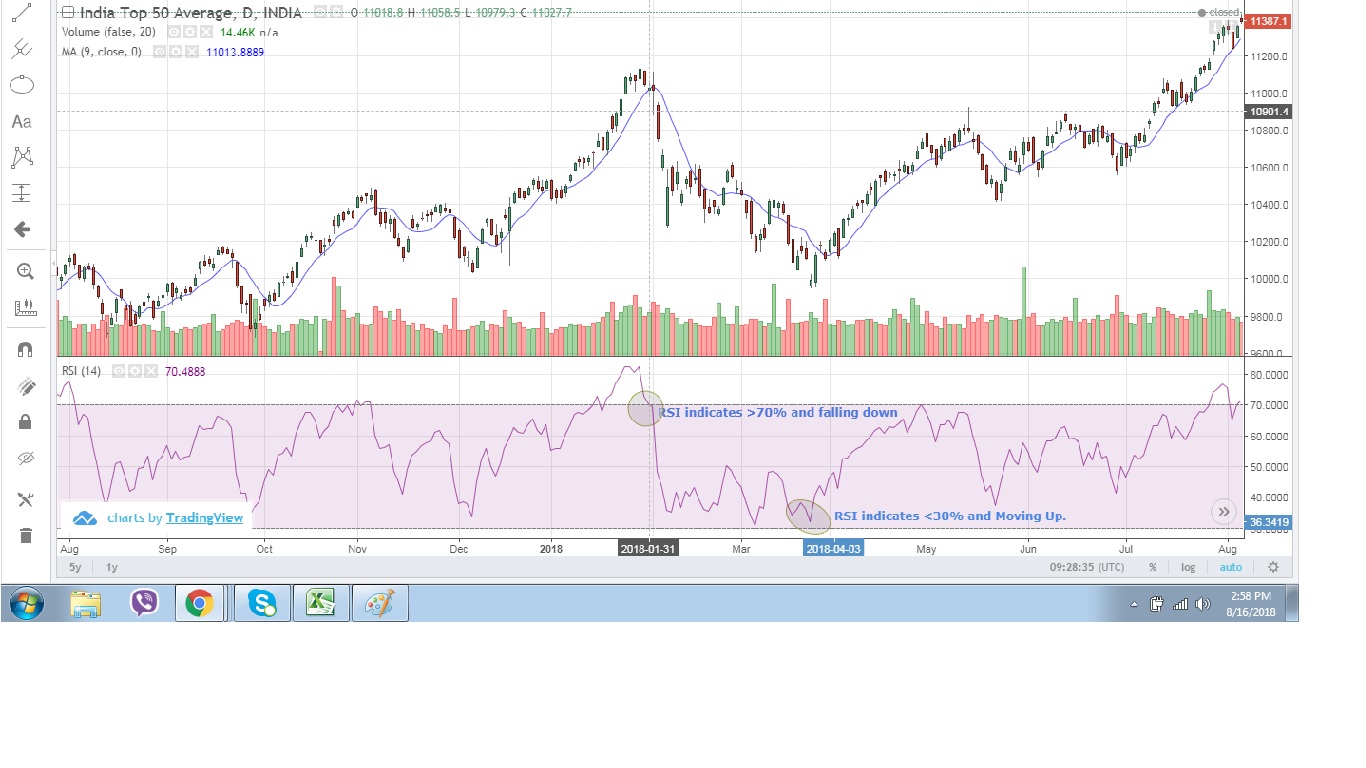
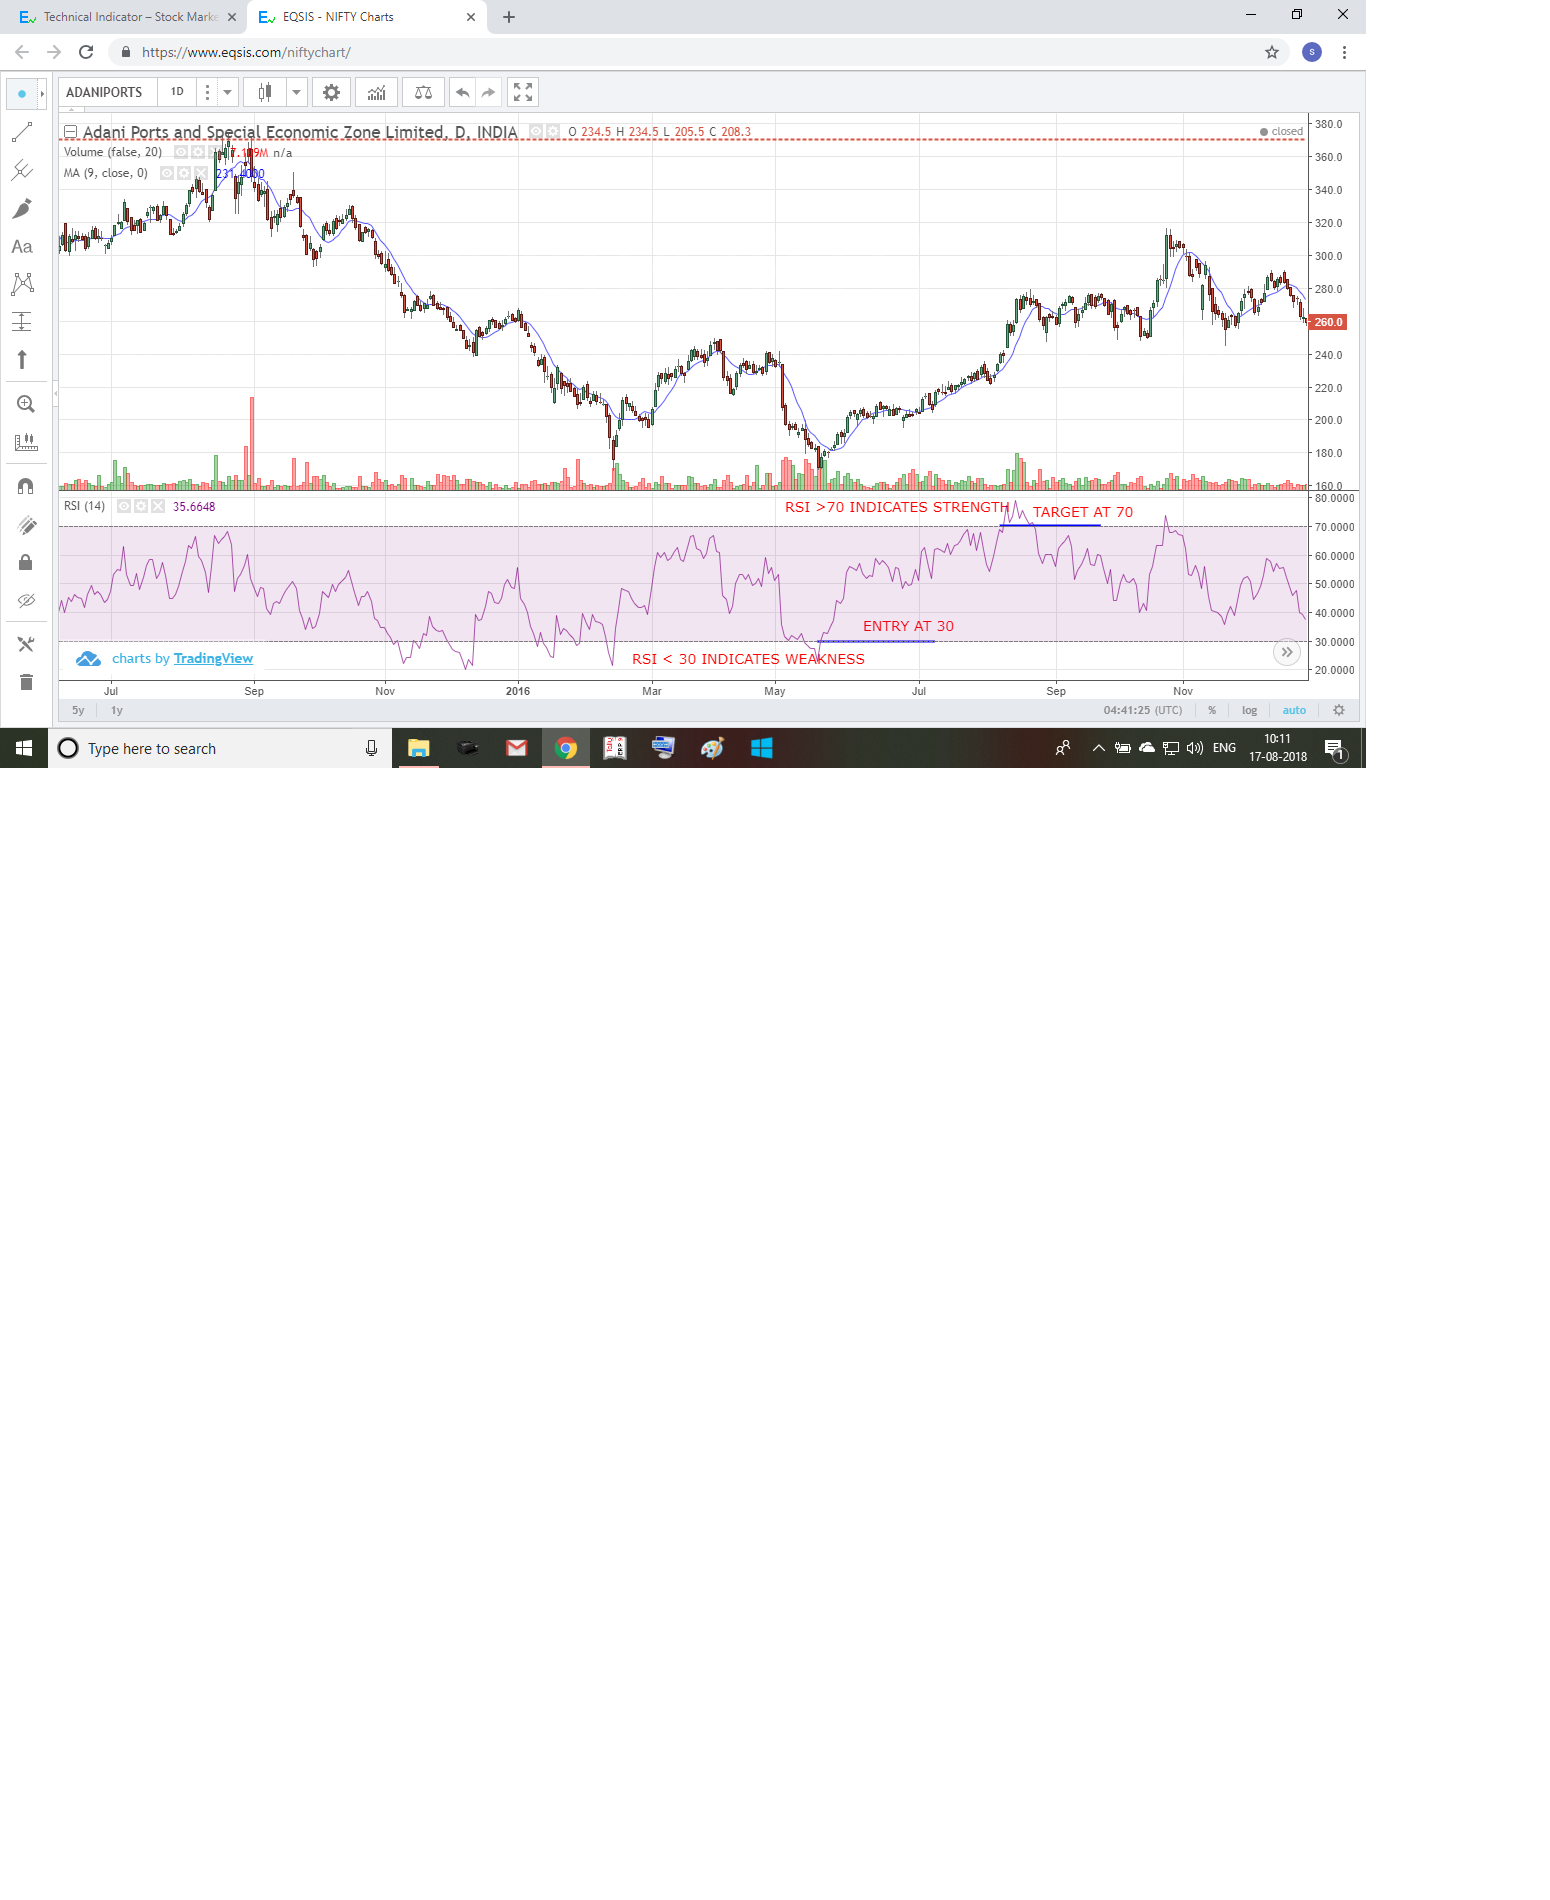
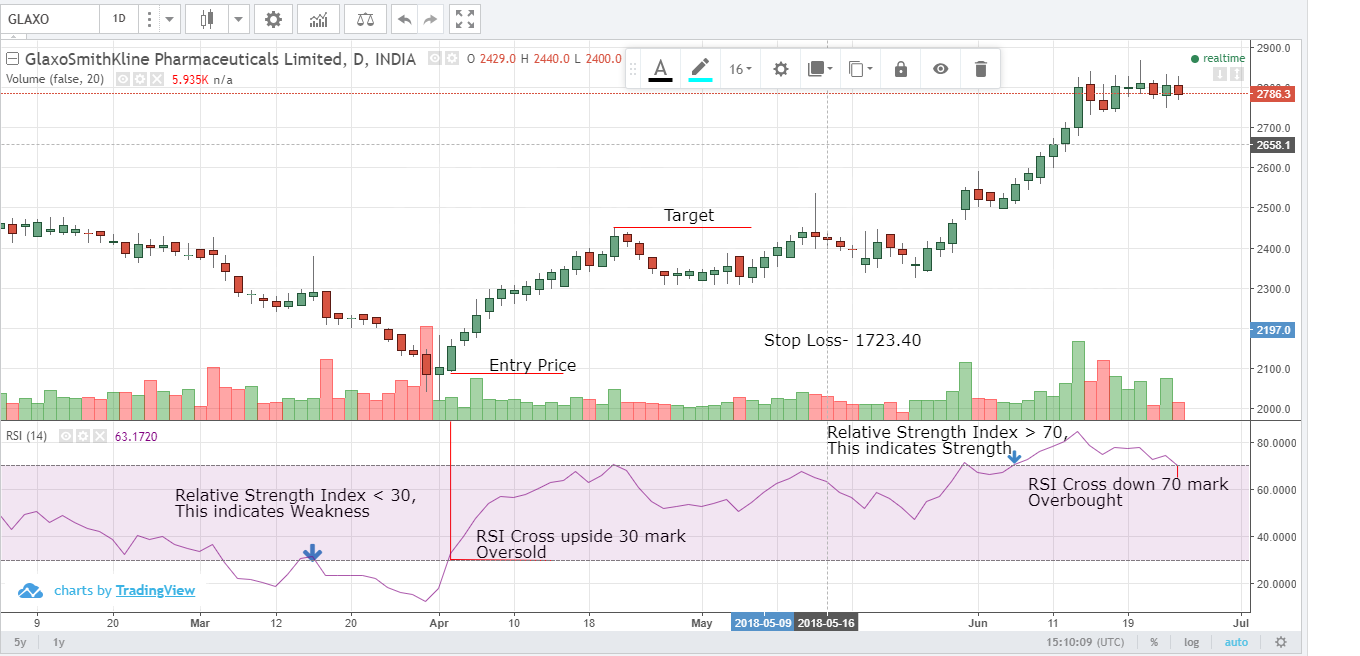
As i look the relative strength indicator,where price goes below 30 shows weaker zone and cross above 70 shows...
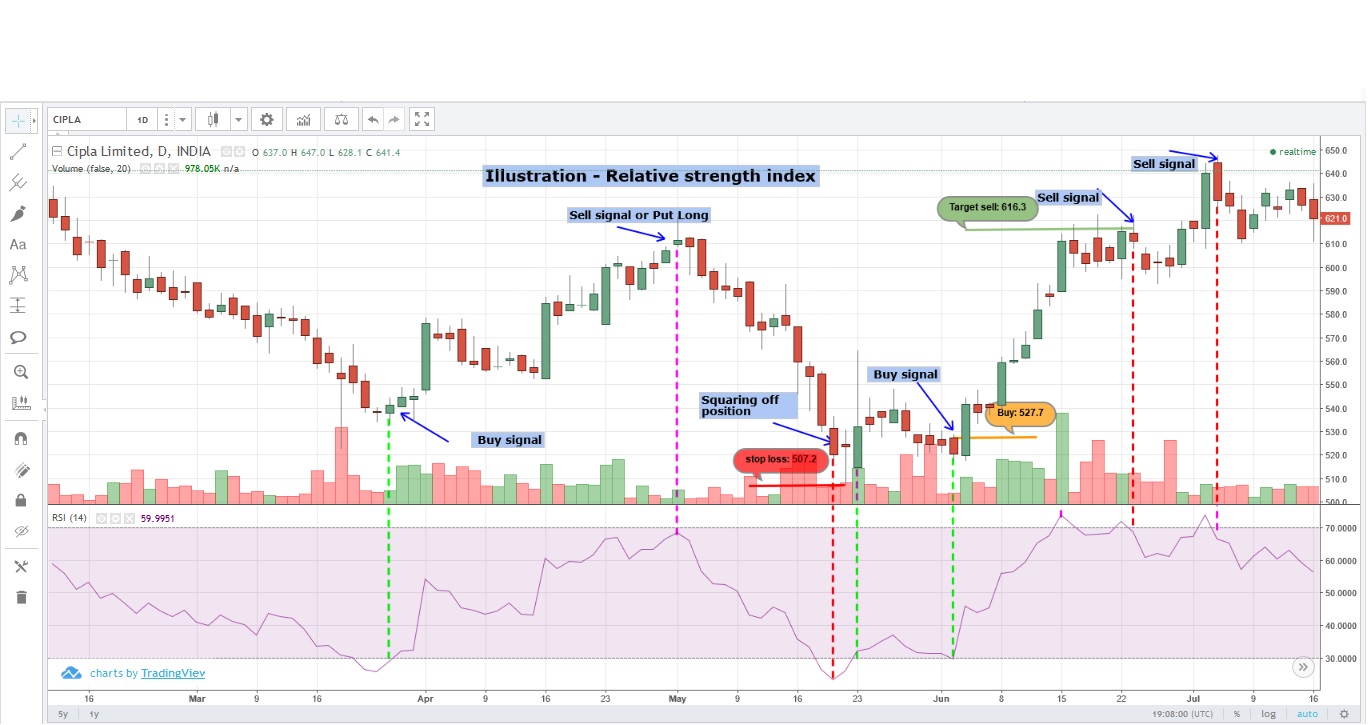
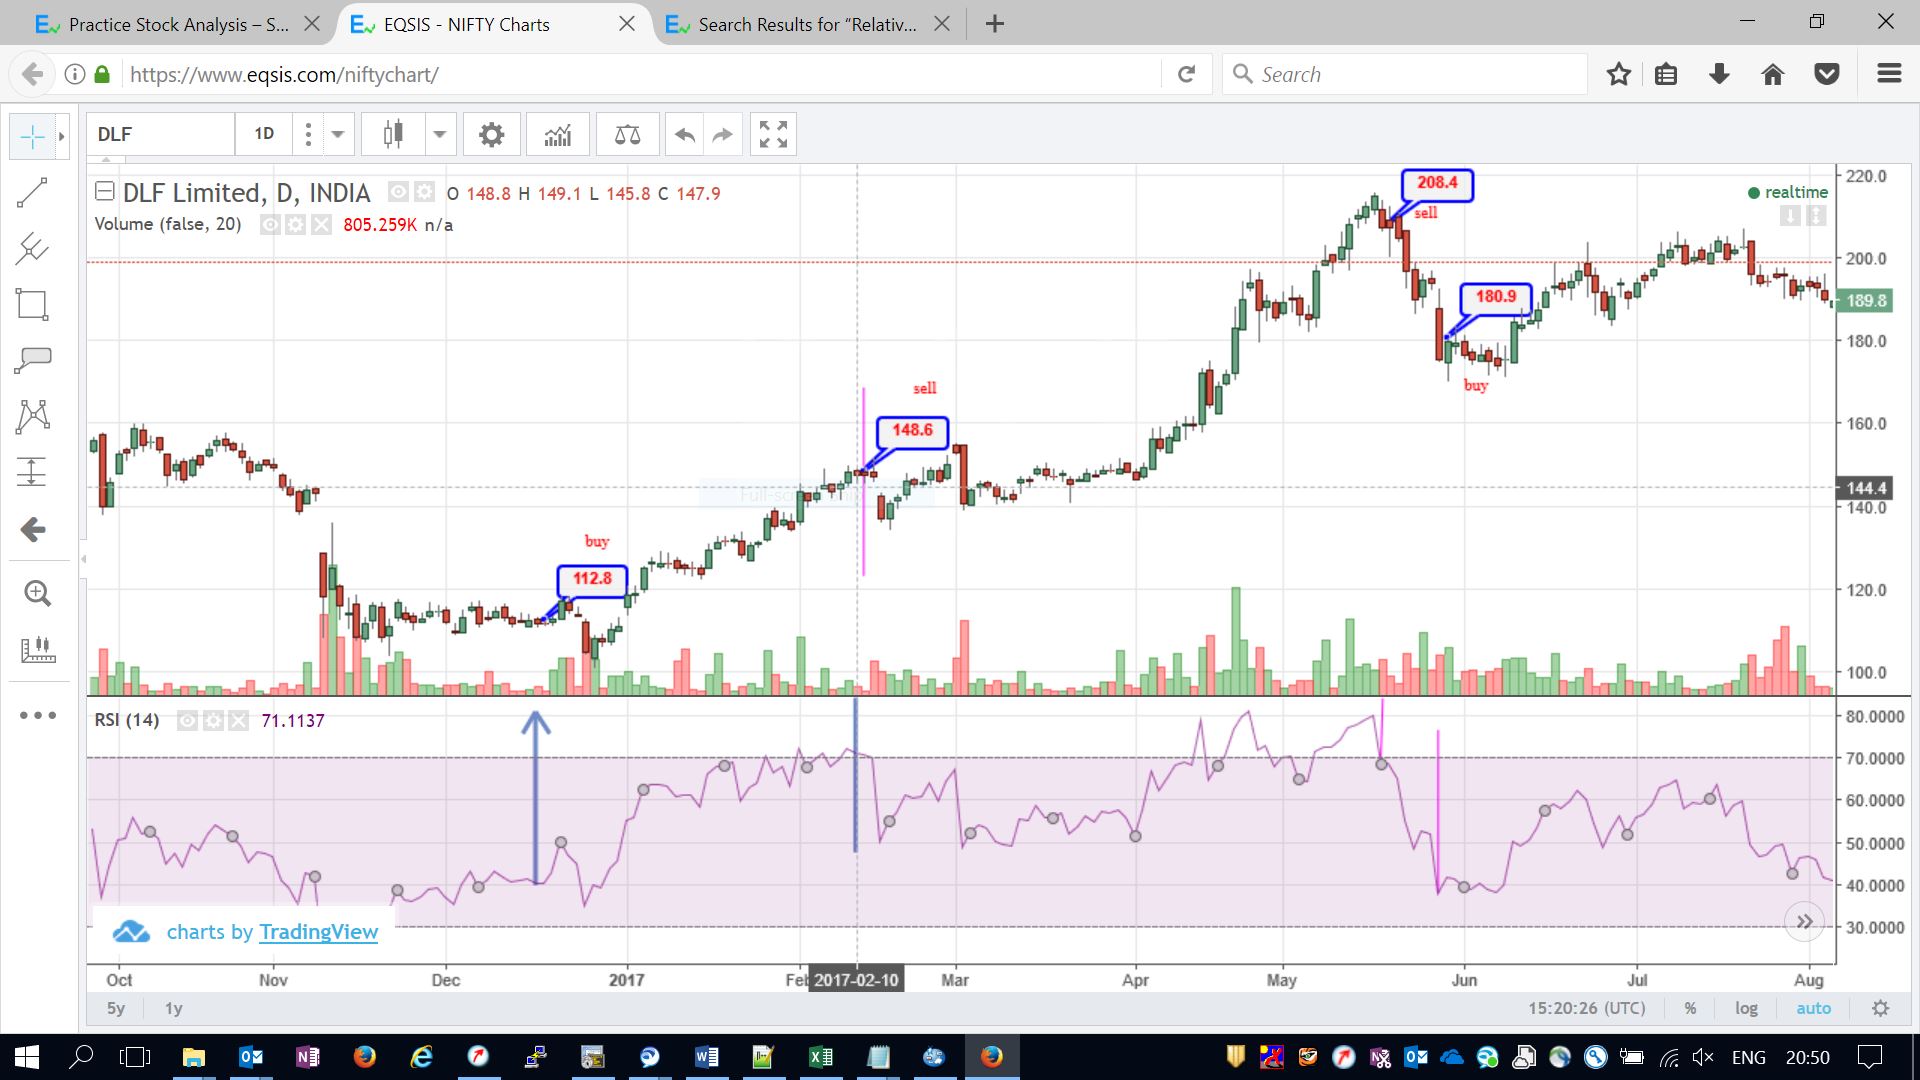
There are many trading opportunities in enclosed chart. For demonstration purpose, applying above principle, following trades are recommended. Buy:...
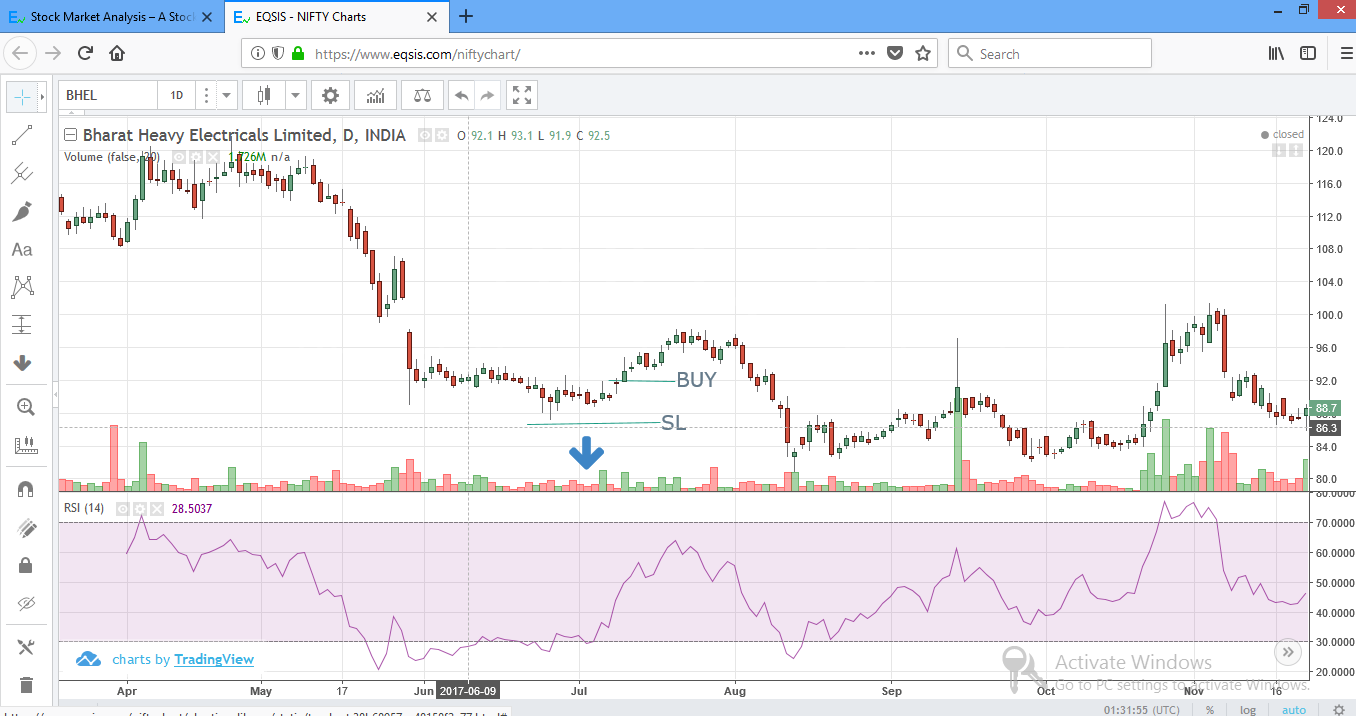
Since the RSI has shown a weakness and subsequently has breached the 30 mark during the period of April...
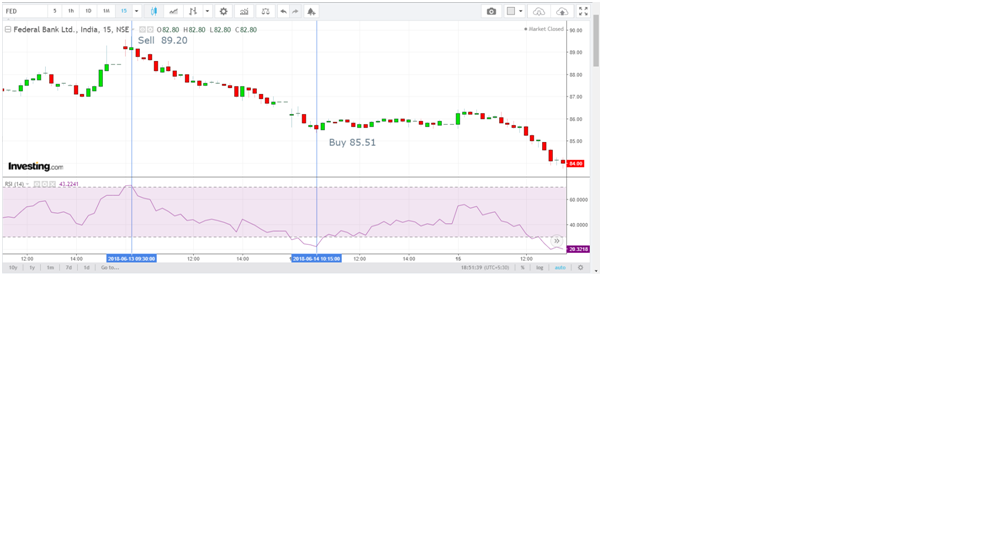
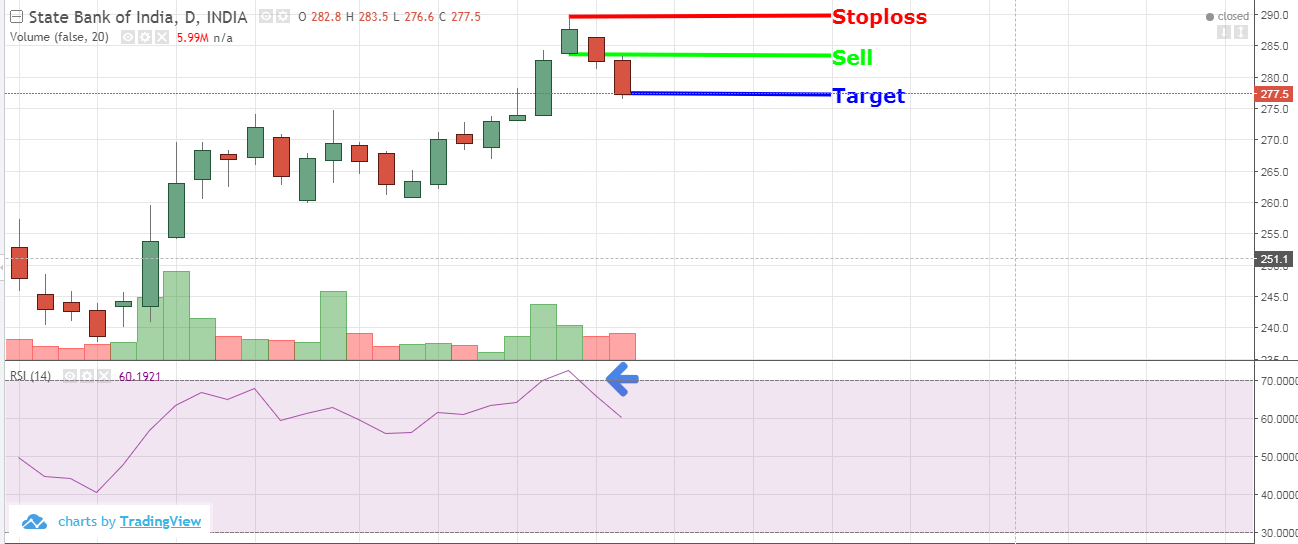
Creating SHort position Sell - 283 Stoploss - 289 Target - 277
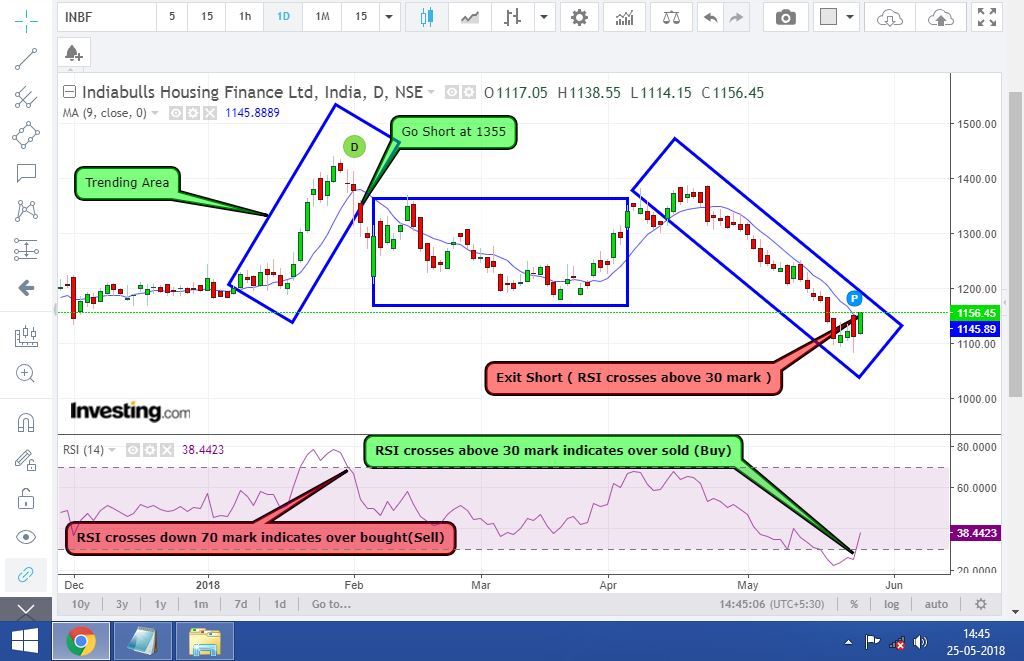
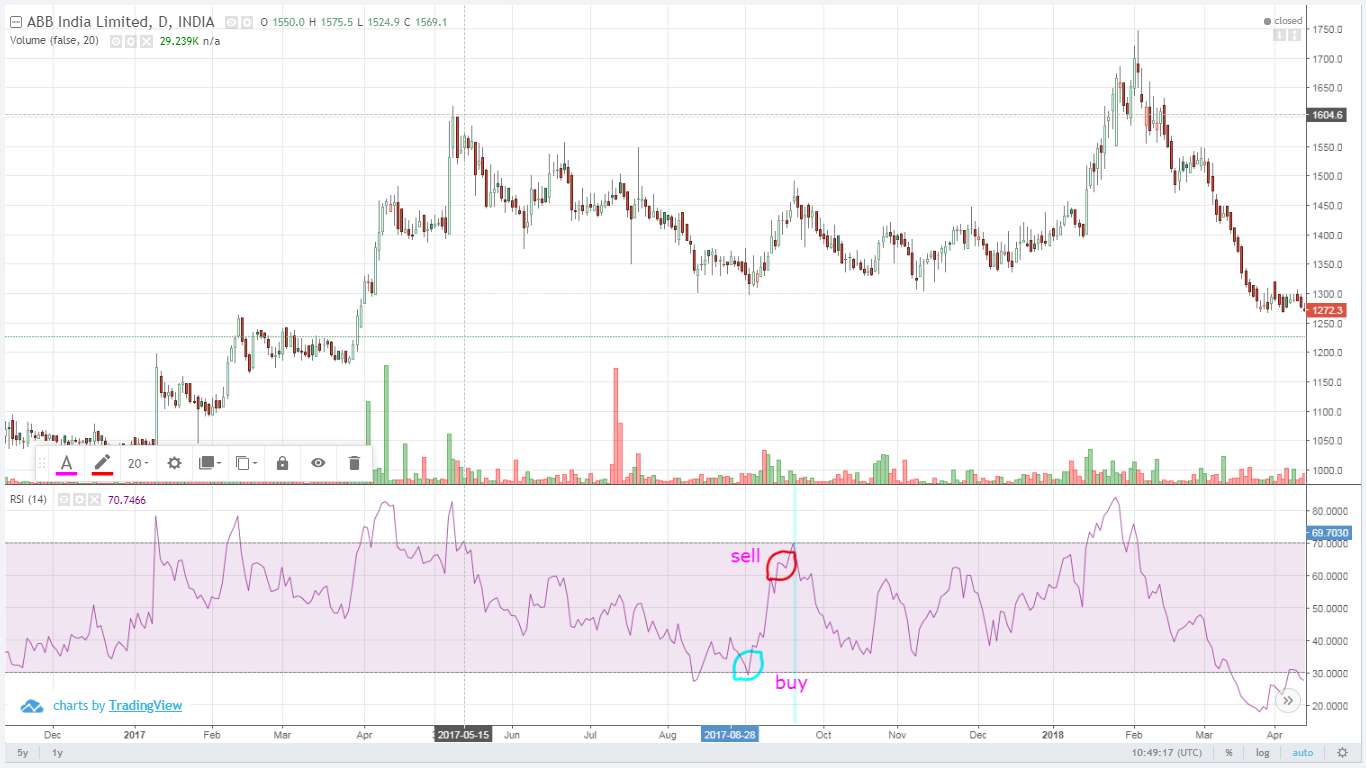
RSI crosses down 70 mark at 1355. So short at 1355 and keep above previous high as SL that...
Recently Active Members
Bullish View


Bearish View
-
 Bearish-GAP-SHORT-BICON-25-10-2019 October 25, 2019
-
 FEDERAL BANK – BEARISH ENGULFING October 17, 2019
-
 Cummins India – Bearish Engulfing – 24Sep19 September 25, 2019
-
 Day29-Tata Motors DVR – Bearish Piercing – 12Sep19 September 12, 2019
-
 Day27-Bearish-Engulfing pattern-Tech Mahindtra-09Sep19 September 10, 2019