
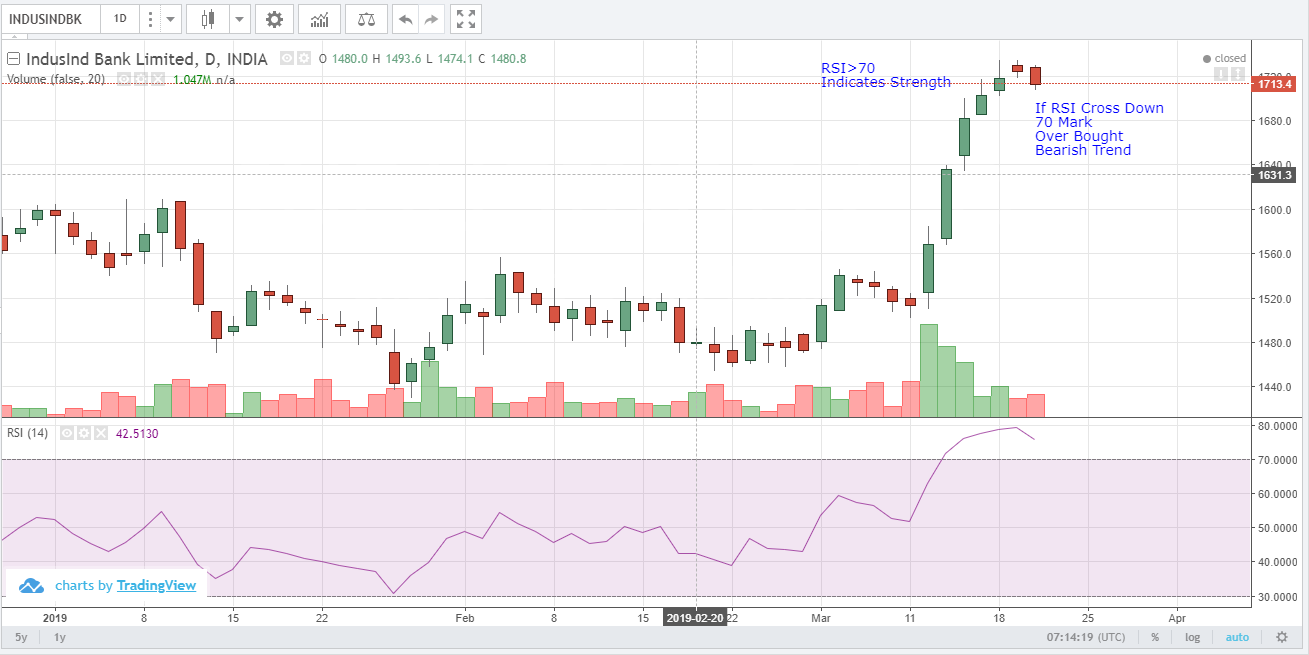
Entry price - 1690 Stop loss - 1740 Target price - 1640
Relative Strength Indicator
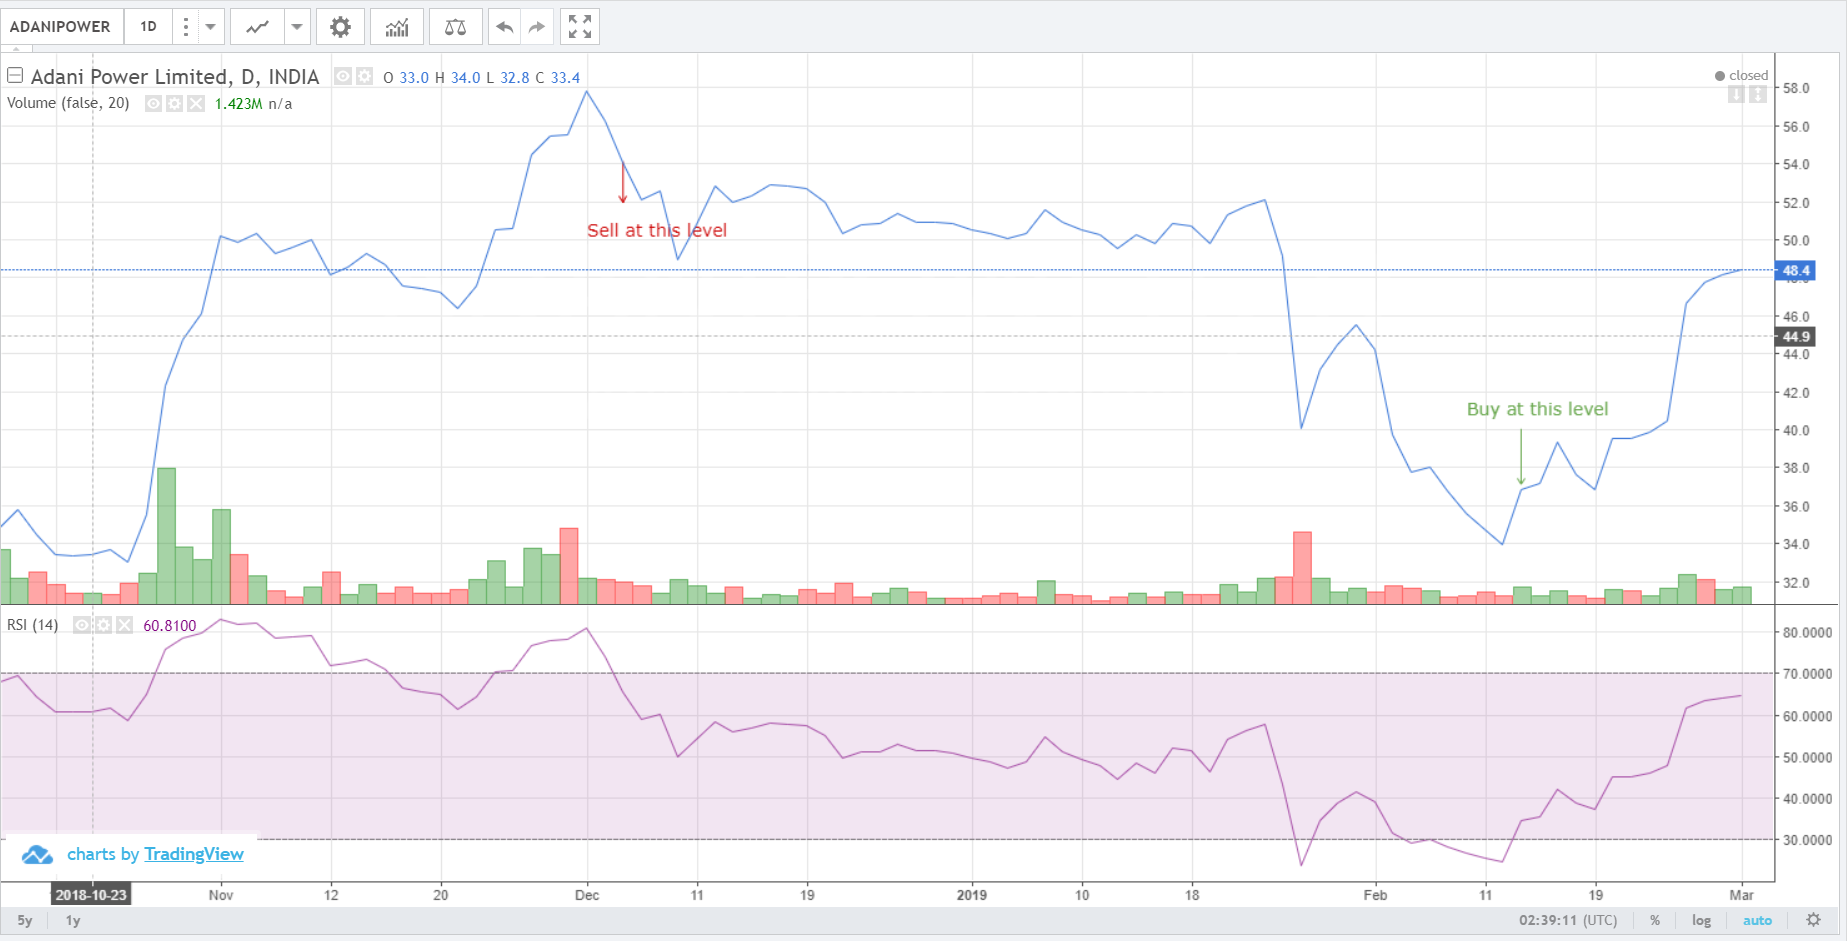
RSI indicates a opportunity to buy and sell in the attached chart. Explaining the sell scenario with entry...
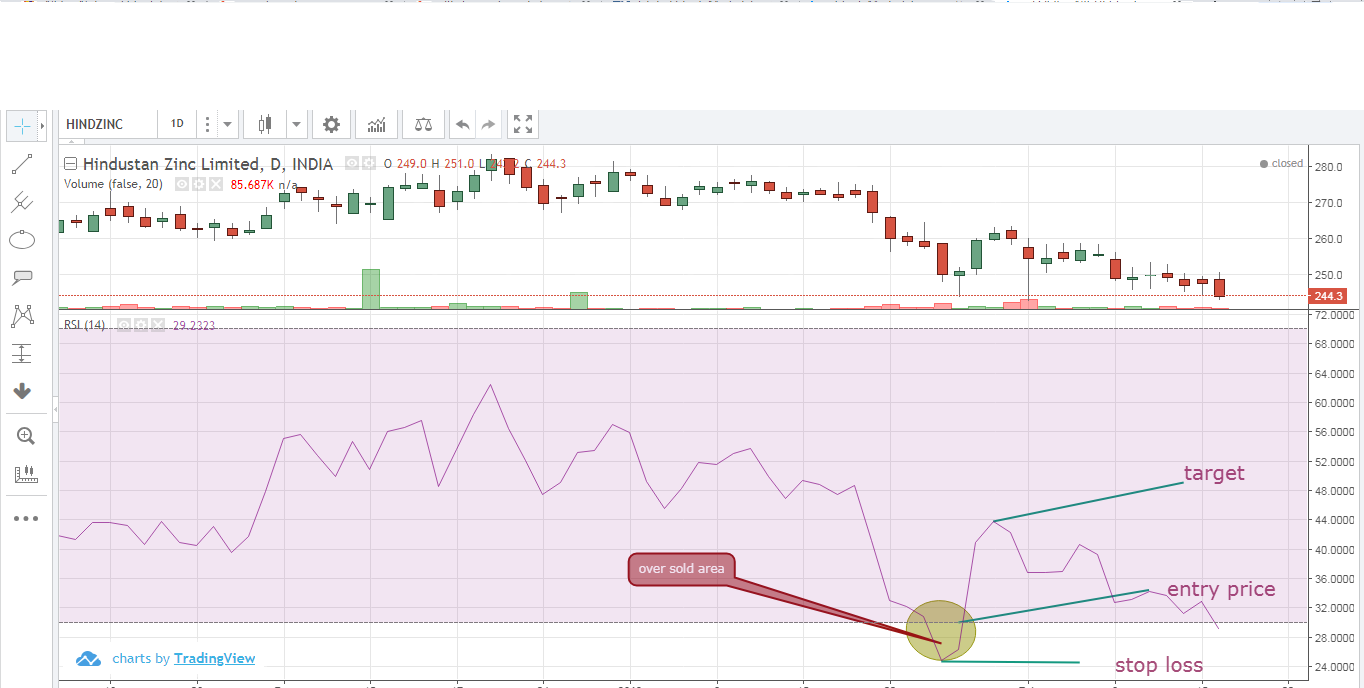
BUY ABOVE : 251 STOP LOSS : 243 TARGET : 263 DURATION...
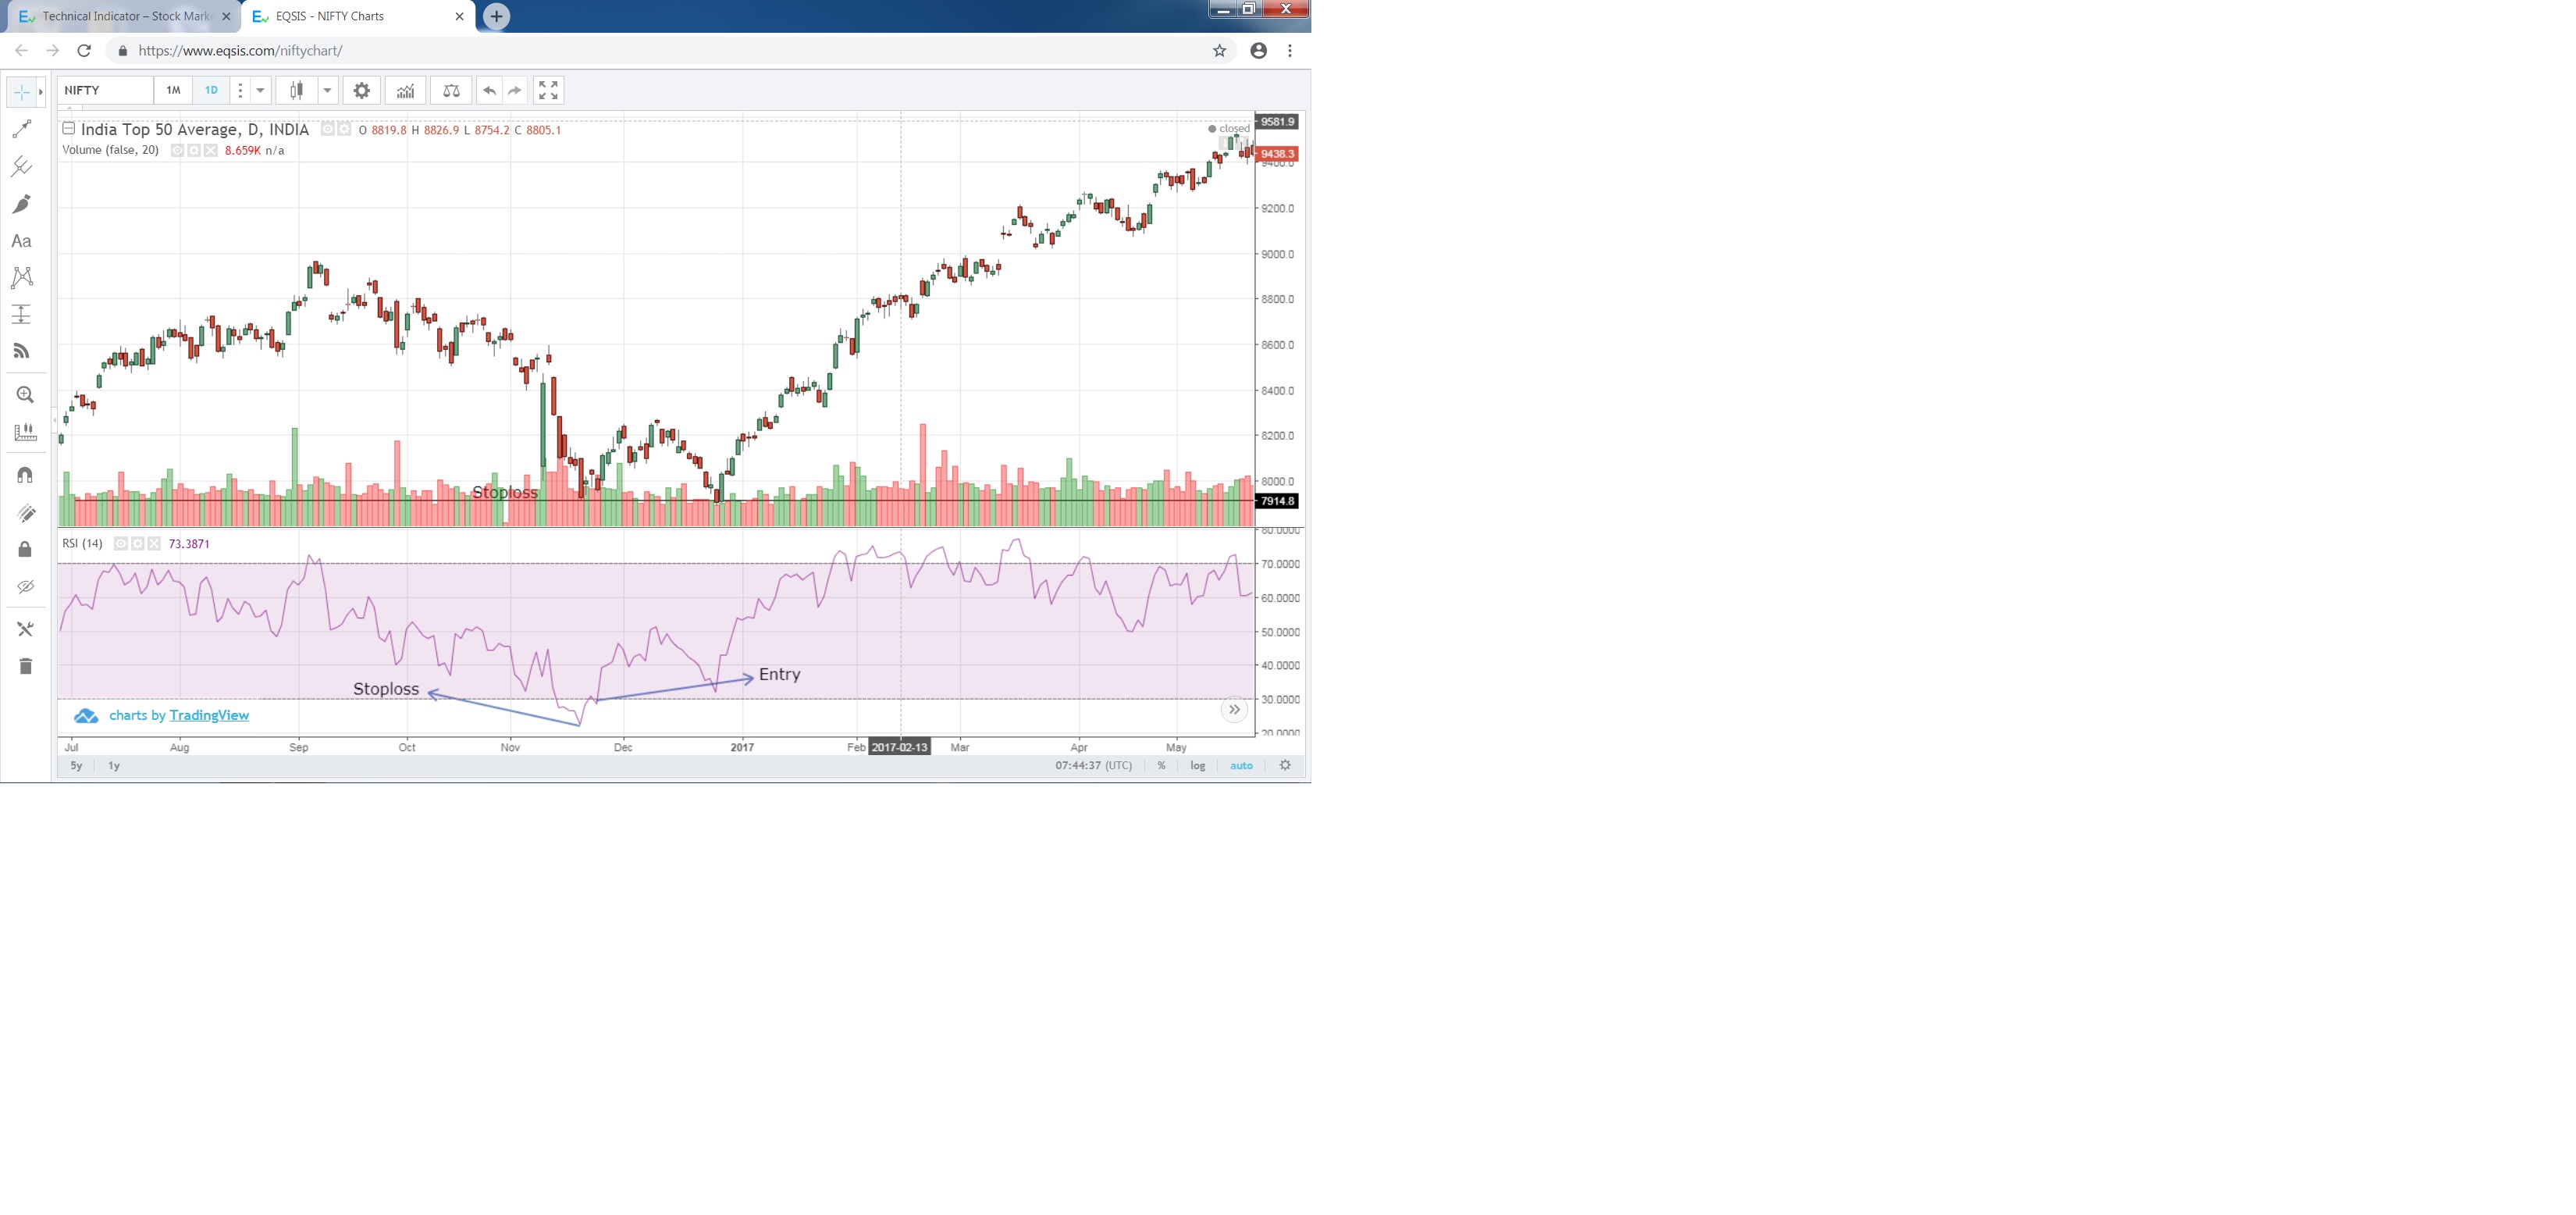
Entry at 7965 with a stop loss of 7916 and a target of 8014.
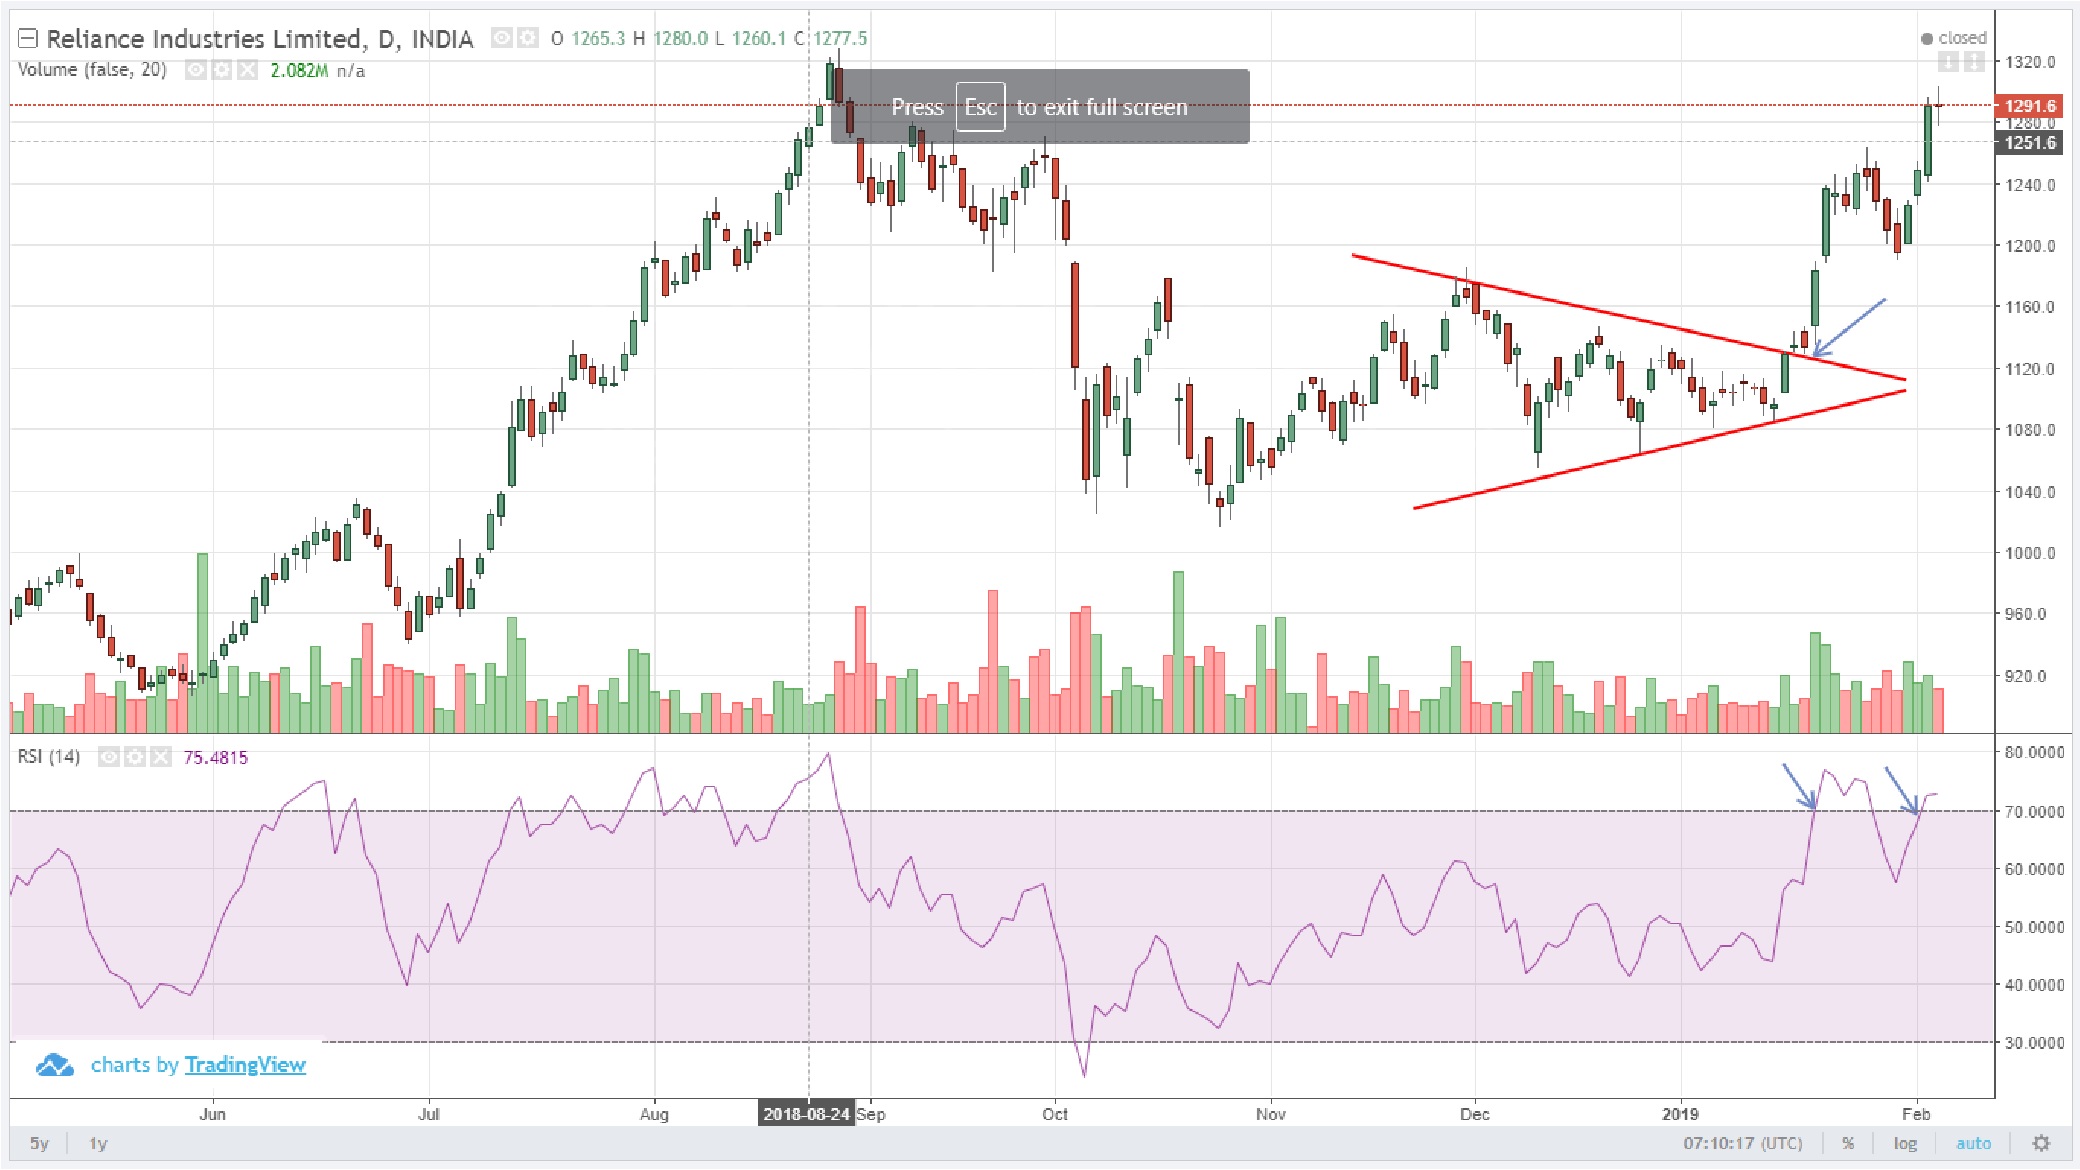
Entry Price: 1135 Stop Loss: 1084 Target Price: 1186 Duration: 1 Month

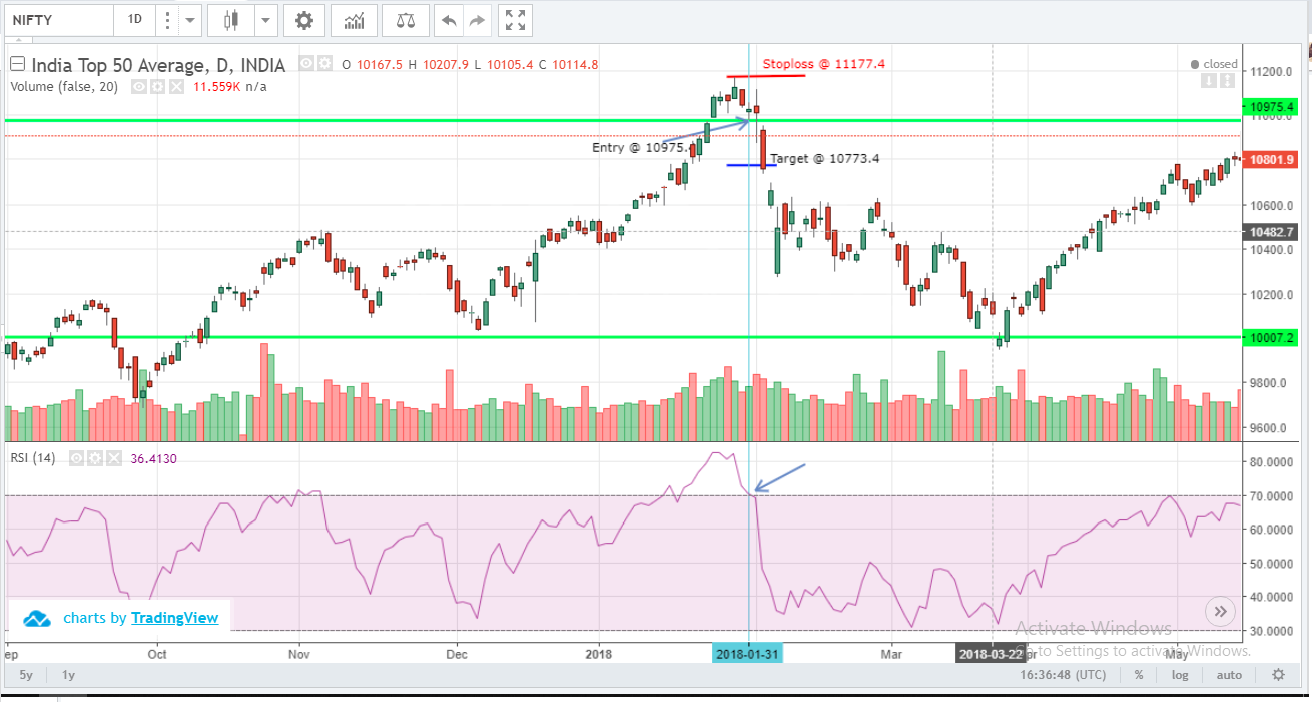
Entry at 10975.4 and the risk taken is 202, and the trade plan is Short according to the RSI...
Recently Active Members
Bullish View


Bearish View
-
 Bearish-GAP-SHORT-BICON-25-10-2019 October 25, 2019
-
 FEDERAL BANK – BEARISH ENGULFING October 17, 2019
-
 Cummins India – Bearish Engulfing – 24Sep19 September 25, 2019
-
 Day29-Tata Motors DVR – Bearish Piercing – 12Sep19 September 12, 2019
-
 Day27-Bearish-Engulfing pattern-Tech Mahindtra-09Sep19 September 10, 2019