
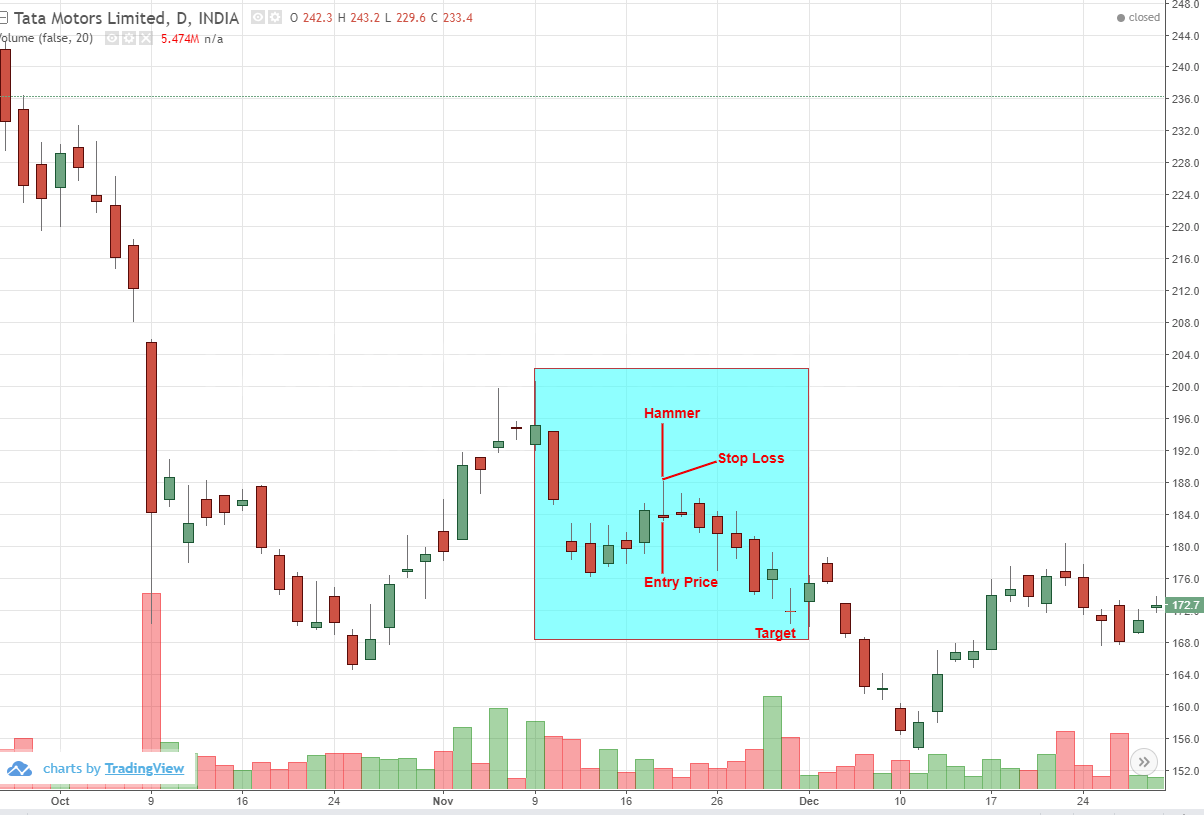
Sell @ 183 for a Target of 172 with a Stop Loss of 188.50.
Hanging Man Candlestick Pattern
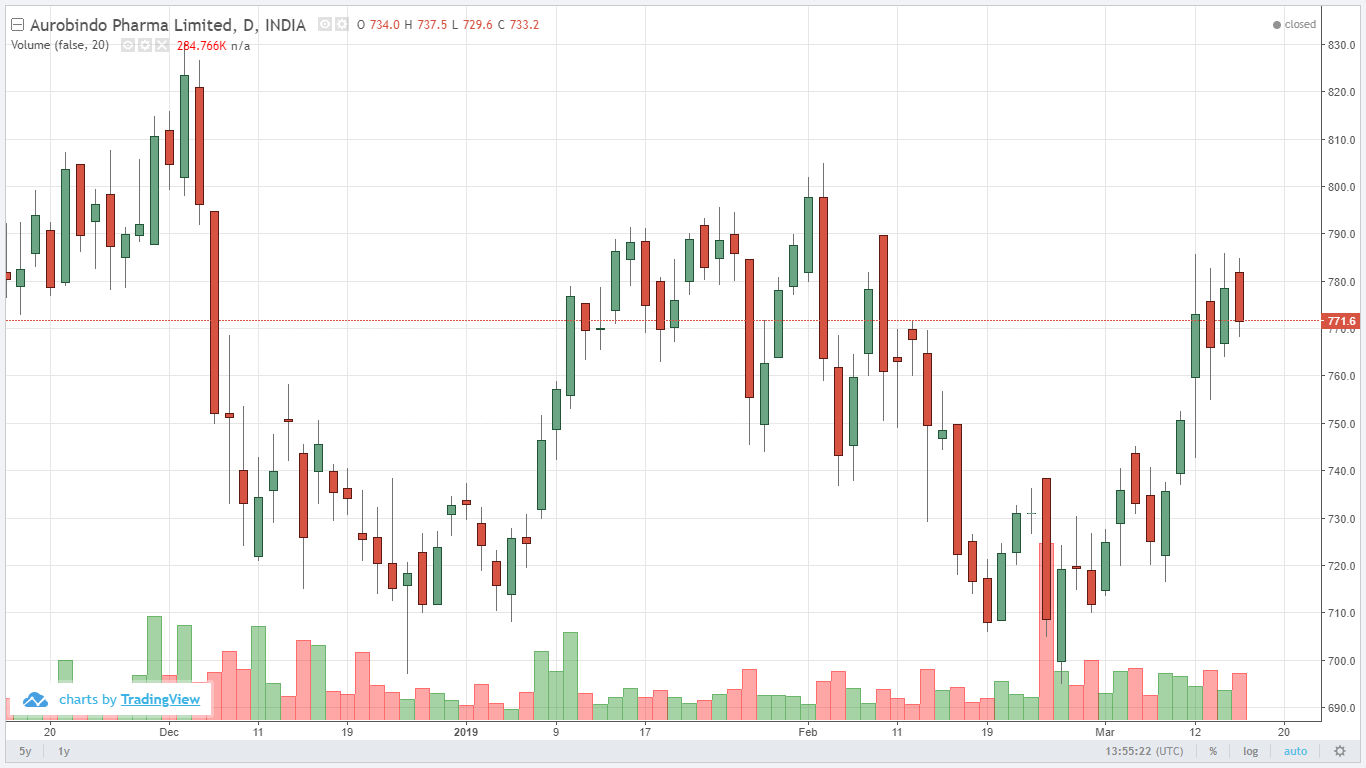
Hangingman pattern reversal trend pattern if formed after a significant rally and can make short position by entering at...


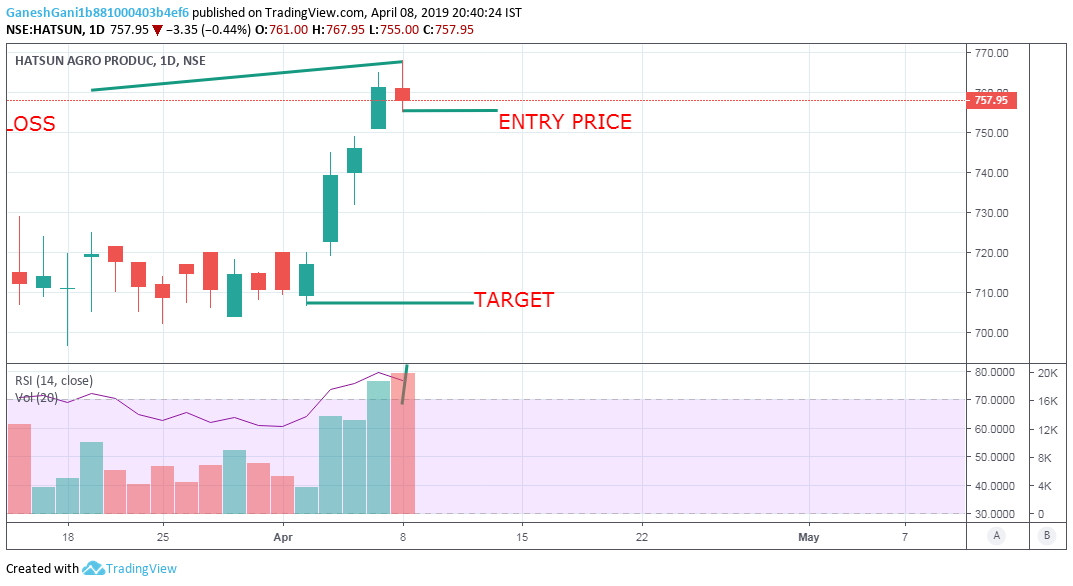
sell below : 755 stop loss : 790 target ...

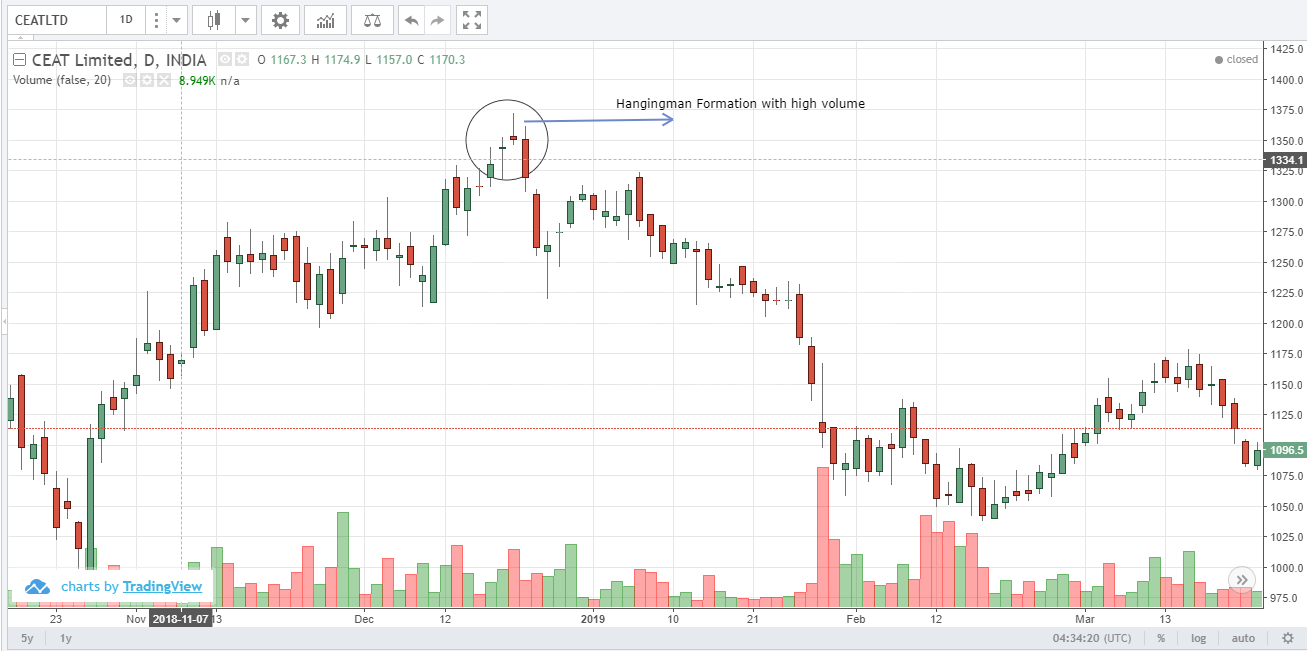
Conditions: - Lower tail should be min 2 times of body size, upper tail should be small in size,...
The hanging man and the hammer are both candlestick patterns that indicate trend reversal. ... If the pattern appears...
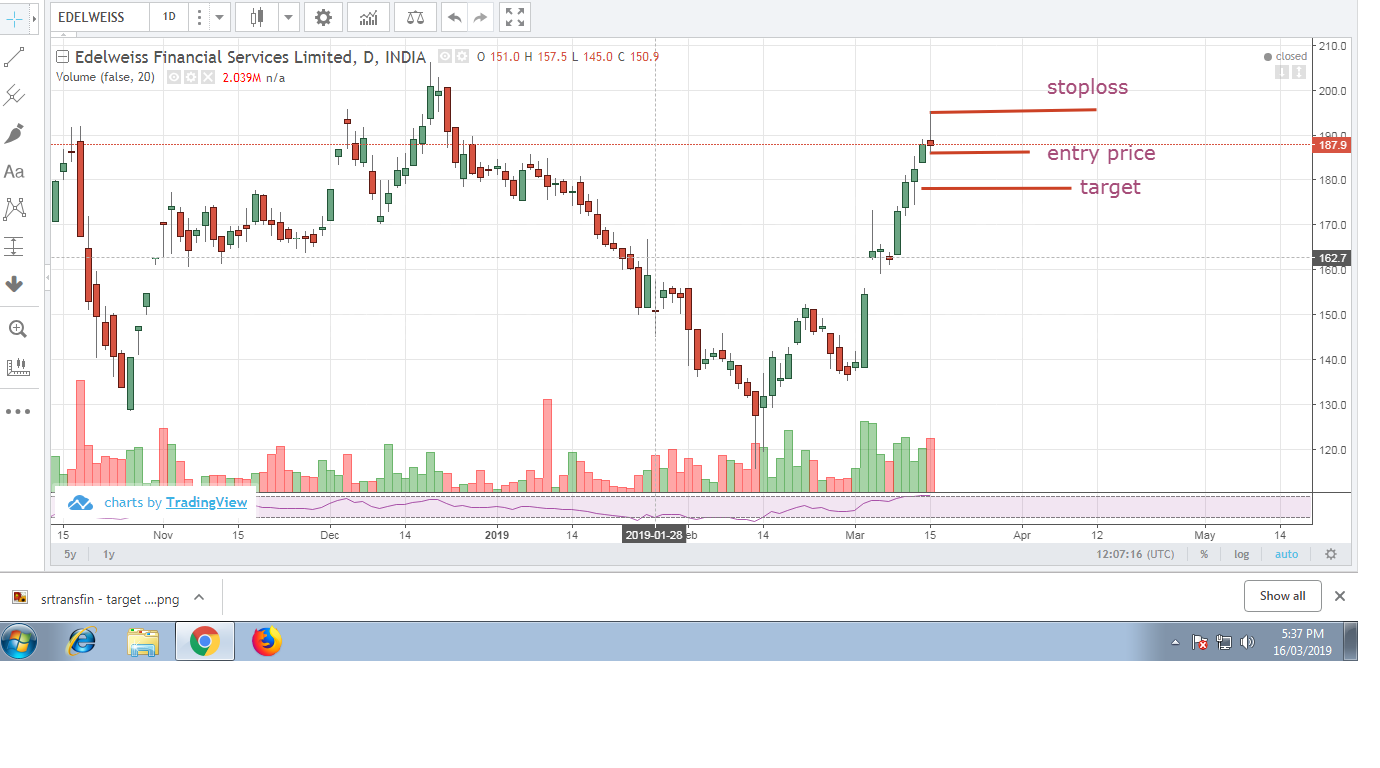
sell below : 185 stoploss : 195 target ...
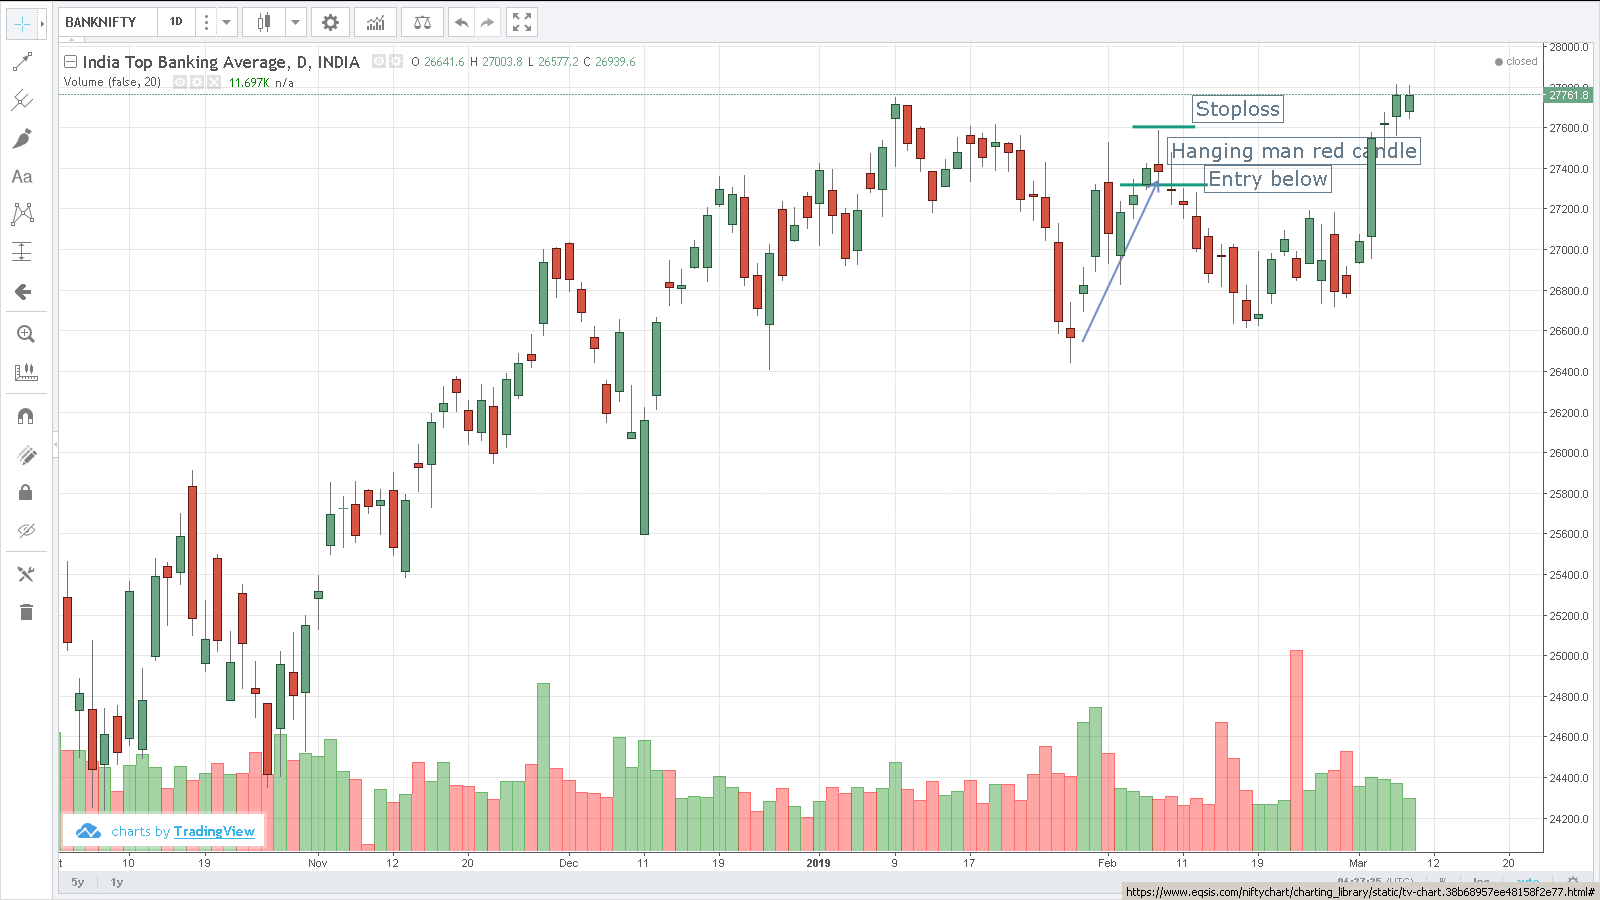
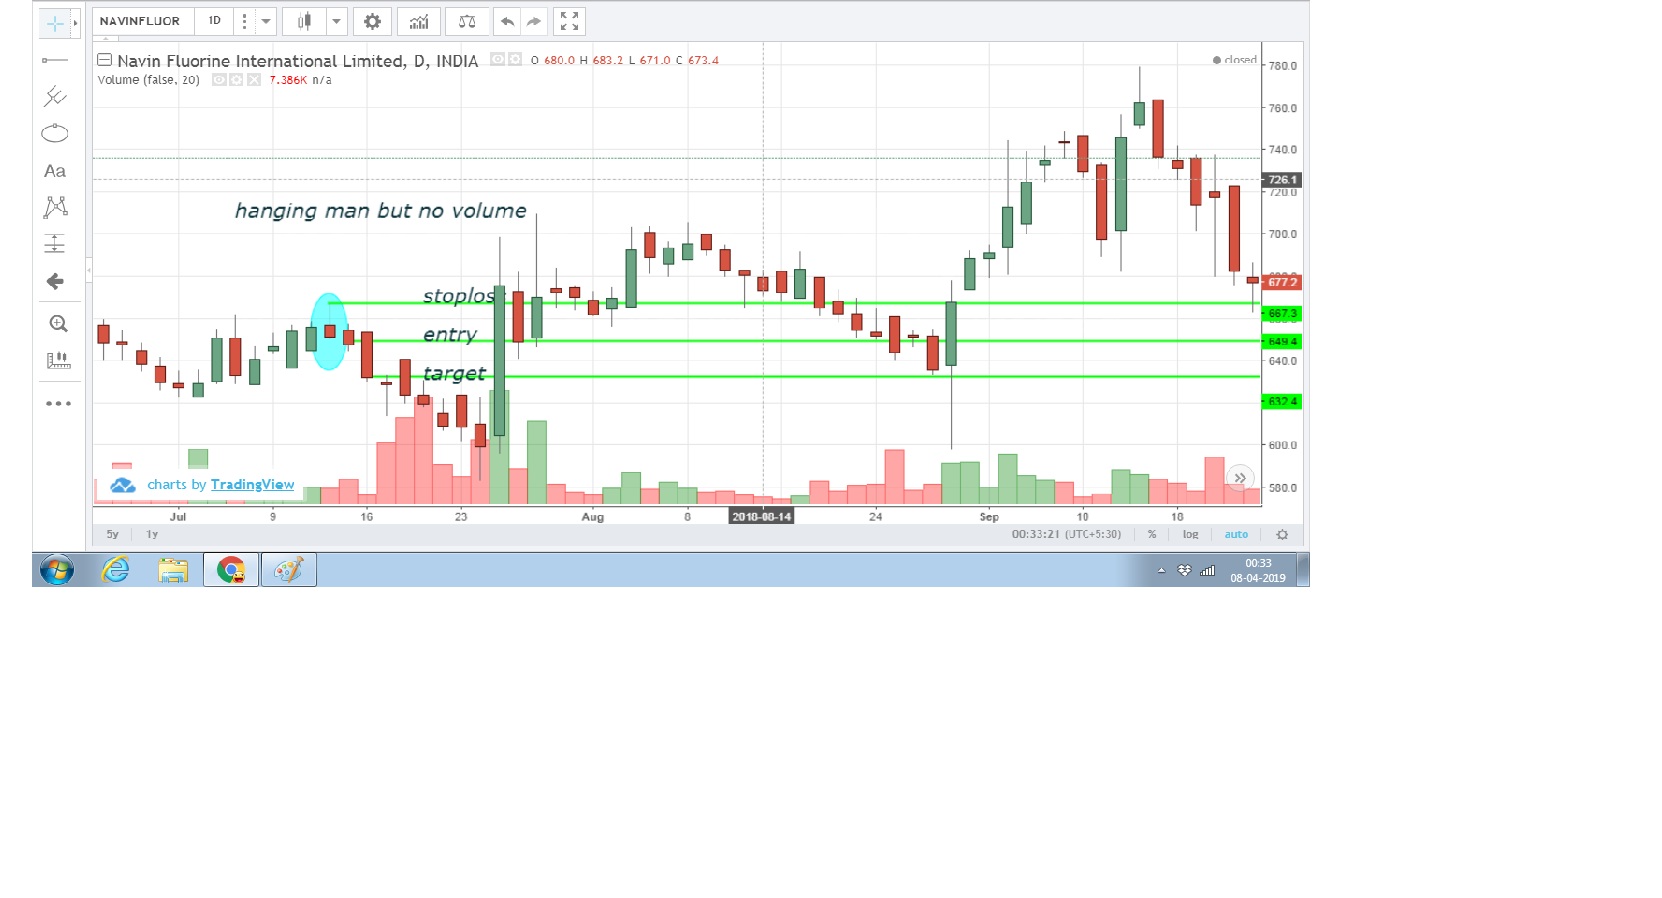
A trade based on hanging man candle stick pattern can be initiated. Sell below 27320, stop loss above...
Recently Active Members
Bullish View


Bearish View
-
 Bearish-GAP-SHORT-BICON-25-10-2019 October 25, 2019
-
 FEDERAL BANK – BEARISH ENGULFING October 17, 2019
-
 Cummins India – Bearish Engulfing – 24Sep19 September 25, 2019
-
 Day29-Tata Motors DVR – Bearish Piercing – 12Sep19 September 12, 2019
-
 Day27-Bearish-Engulfing pattern-Tech Mahindtra-09Sep19 September 10, 2019