
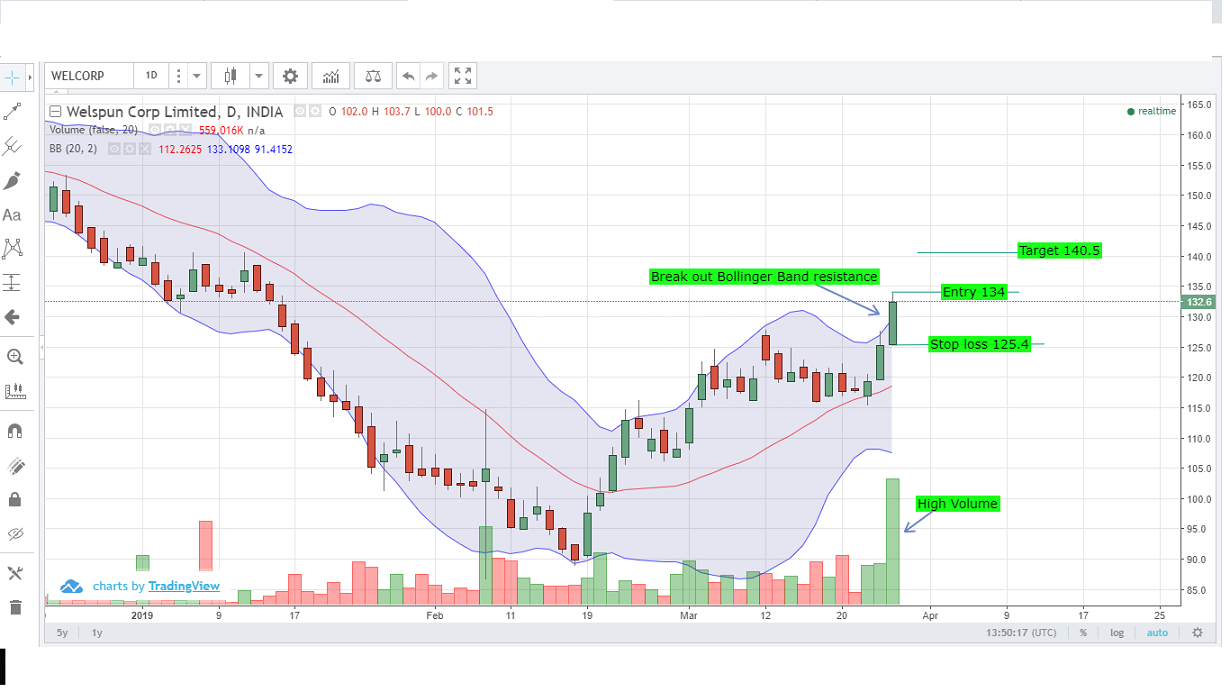
Bullish Break out Bollinger band resistance can be seen in welspun corp with very high volume.
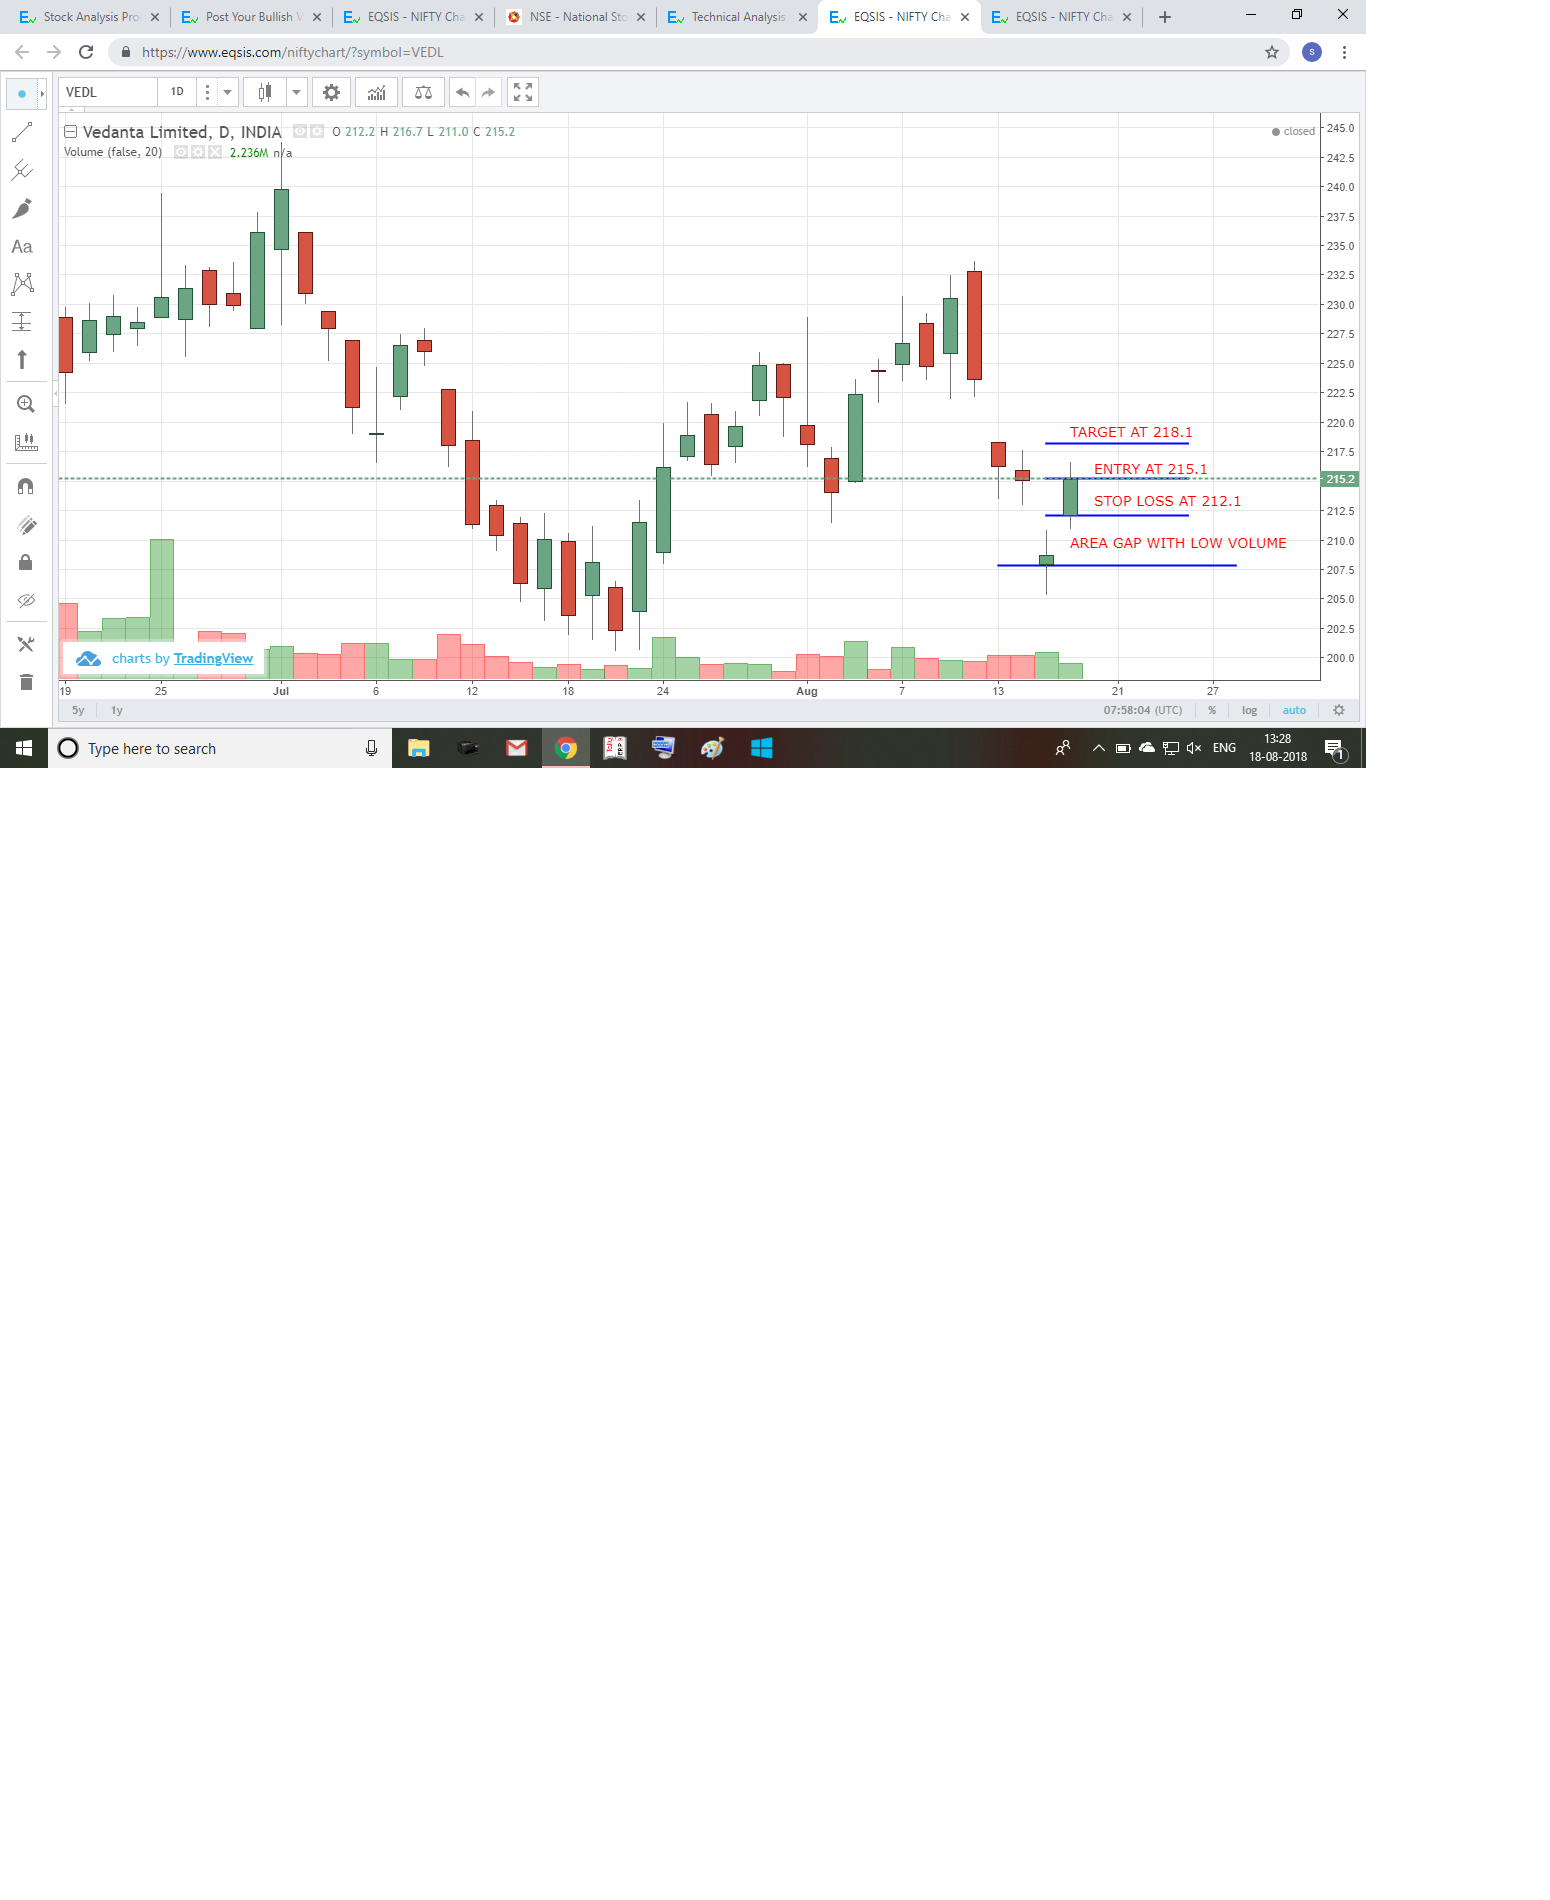
As i look area gap with low volume after price fall and another area gap formed with gap not...
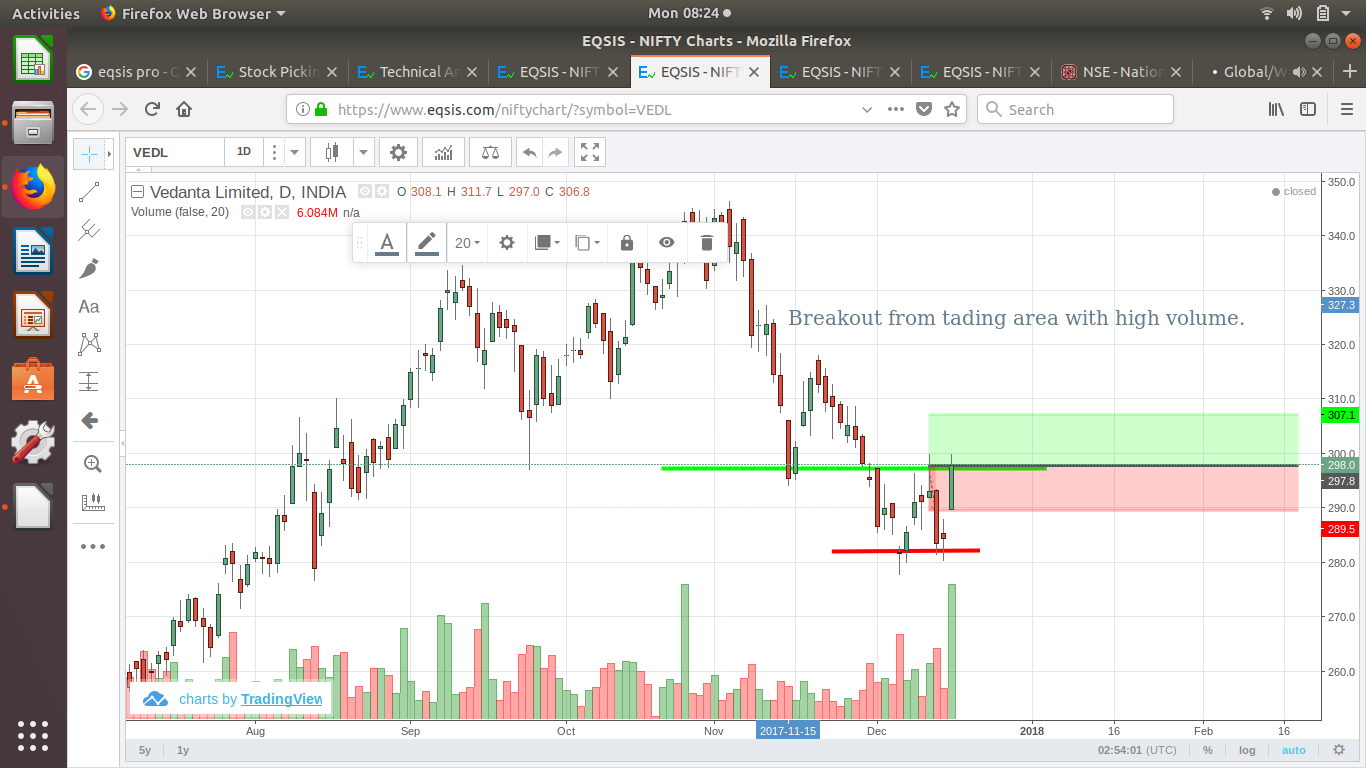
After continuous Bearish rally, Trend reversal is identified with high volume.
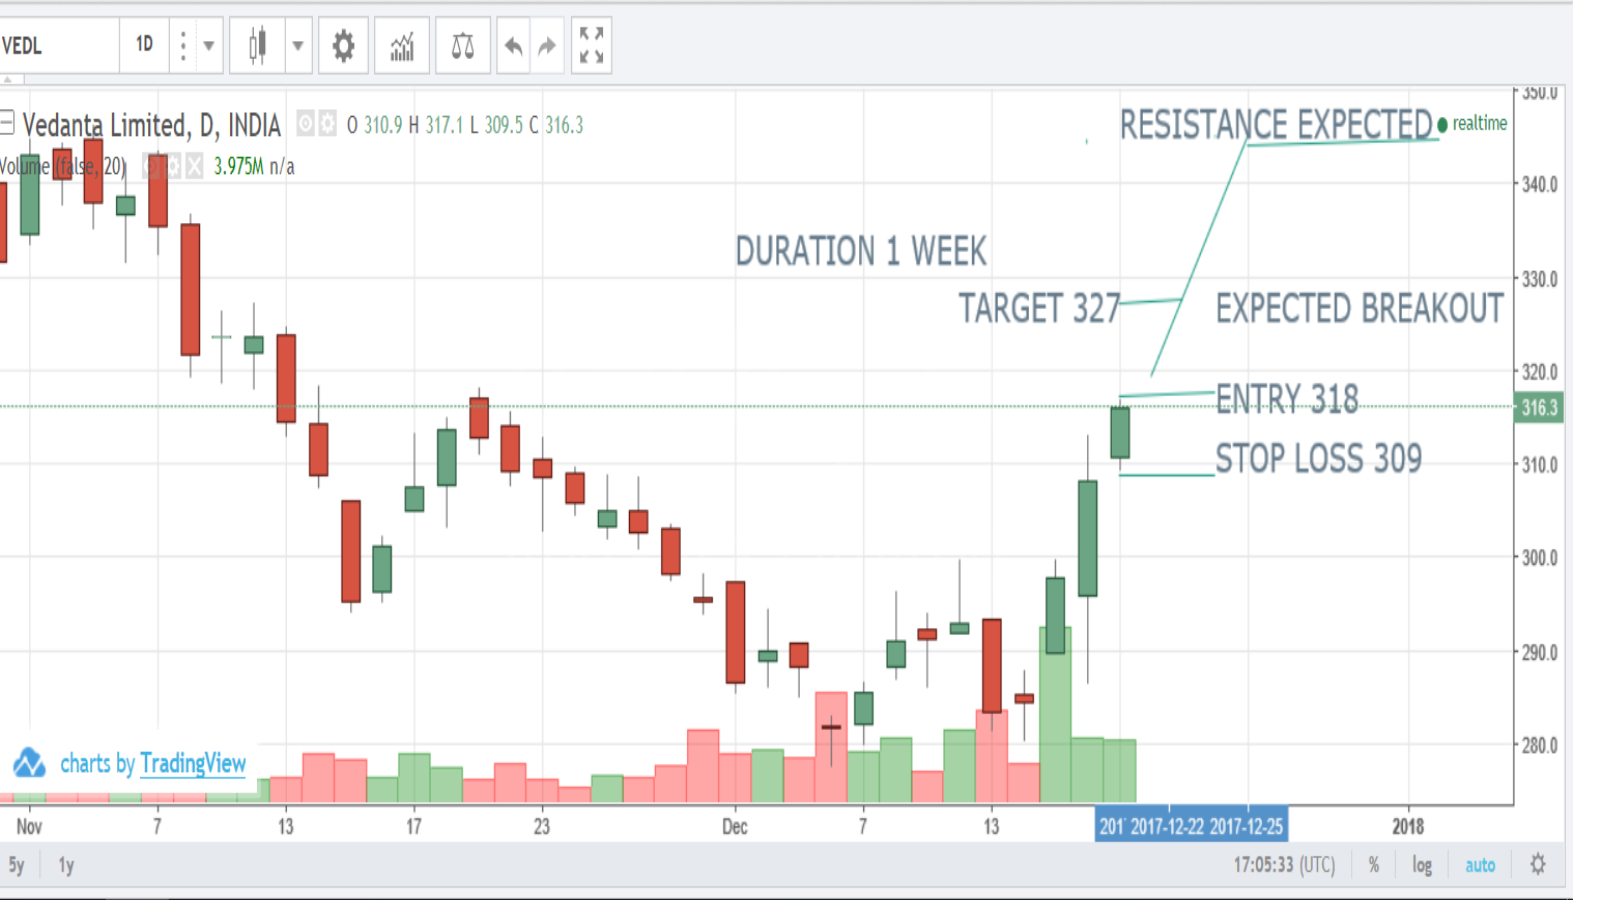
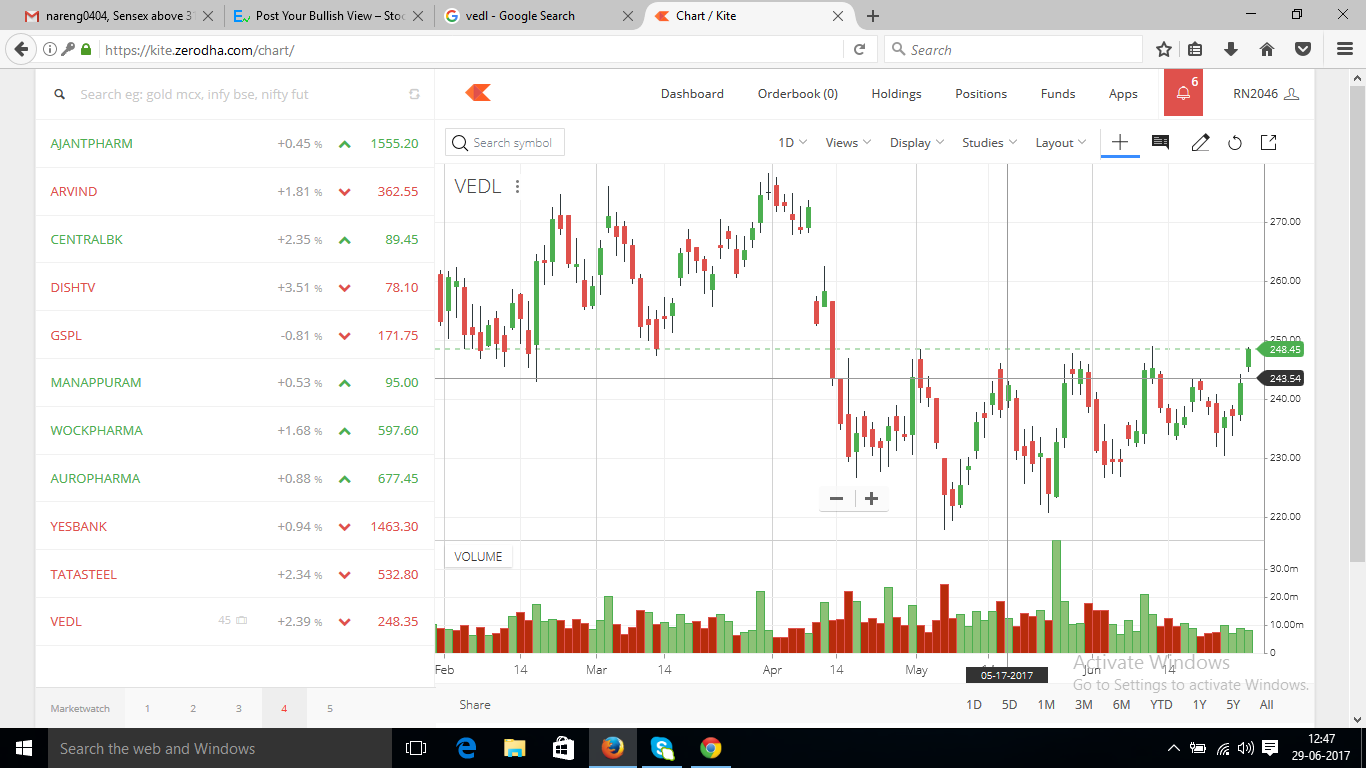
VEDANTA IS AT PRESENT TRADING WITHIN THE RANGE. BULLS ARE ACTIVE NOW. TODAY ALSO BULLISH CANDLE IS SEEN. NOW...
vedl – breakout
Chart shows surge in the volume and trading area is about to break. price surge is expected.

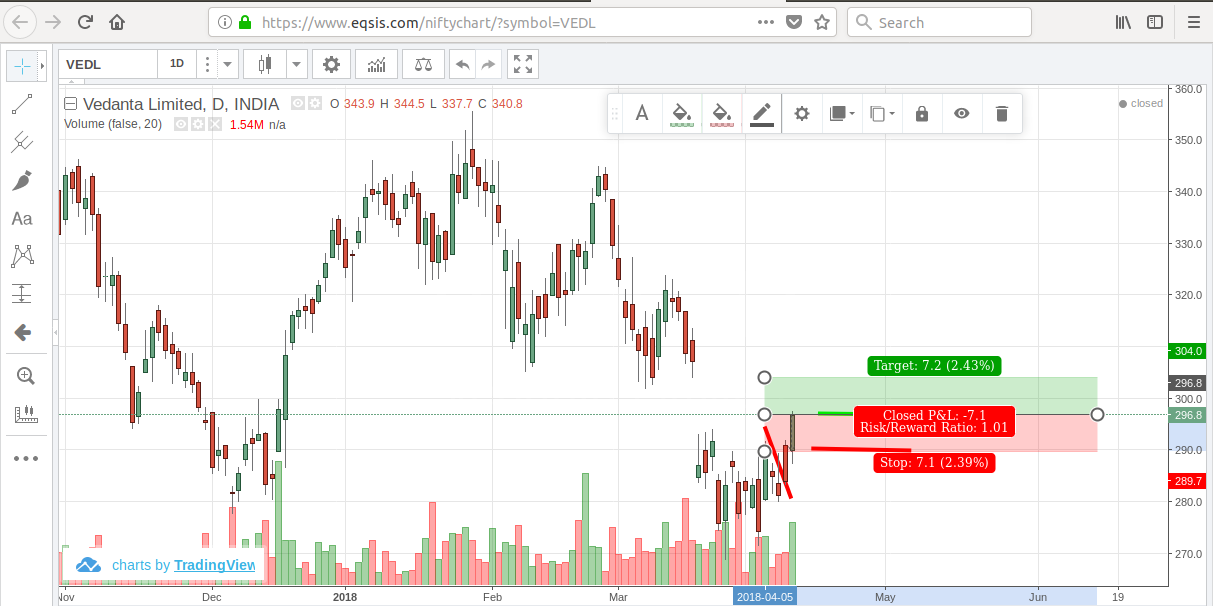
Identified the stock VEDL opened a gap in Bullish trend Entry, Stoploss and Target as according to the attached...
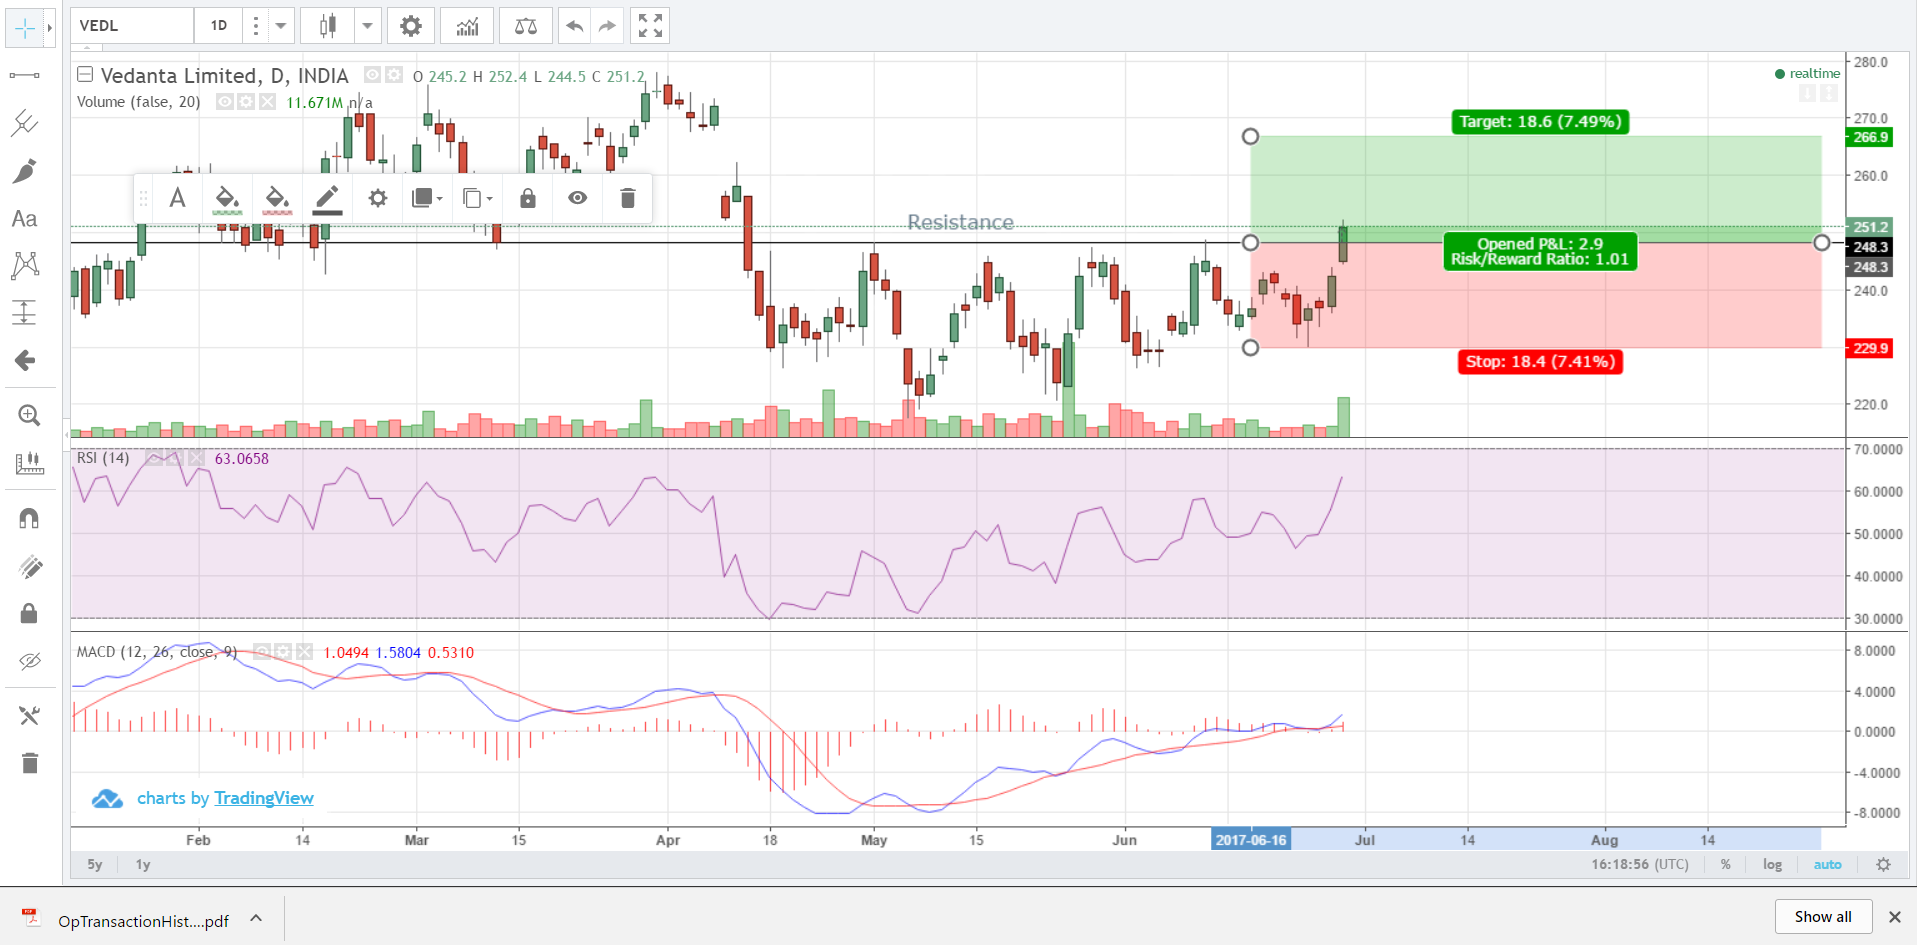
Observed a bullish breakout in VEDL after consolidation within a range for a long time with very good volume.Both...
vedl share has formed triangle pattern and today it has crossed its previous resistance limit. so we can expect...
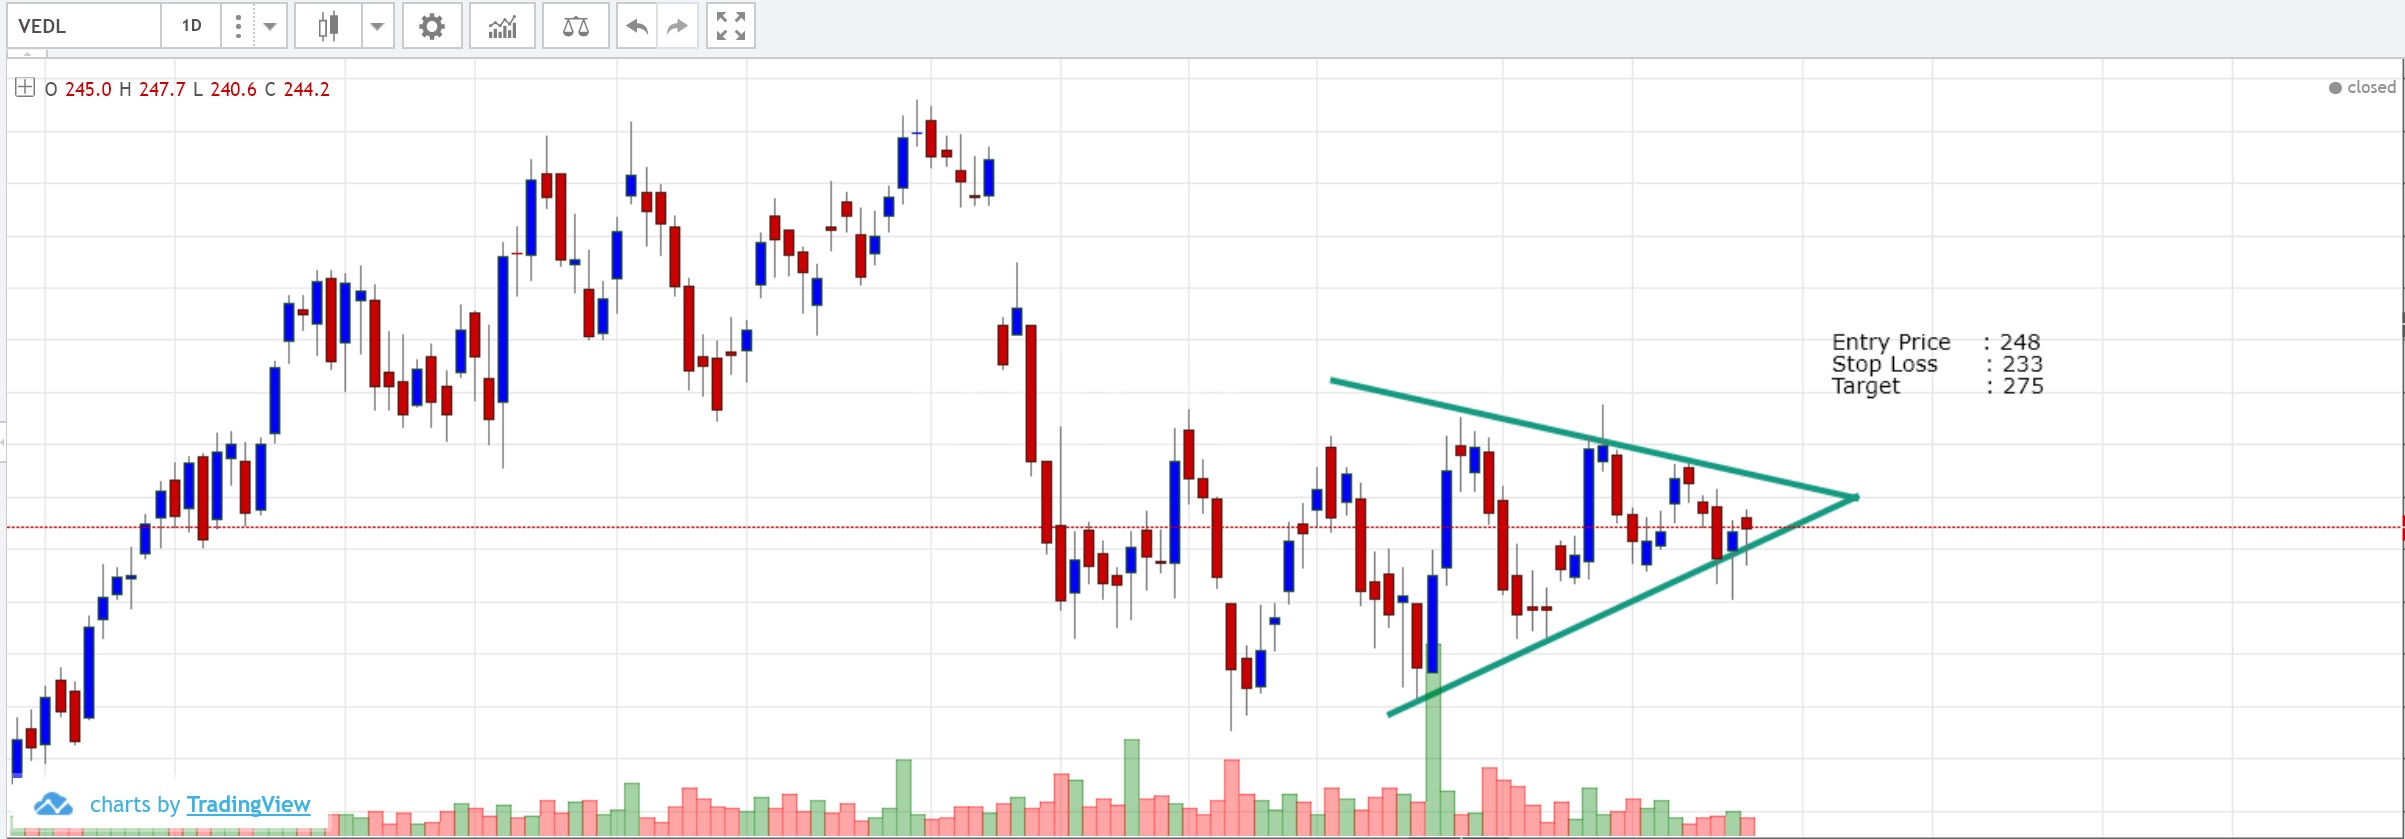
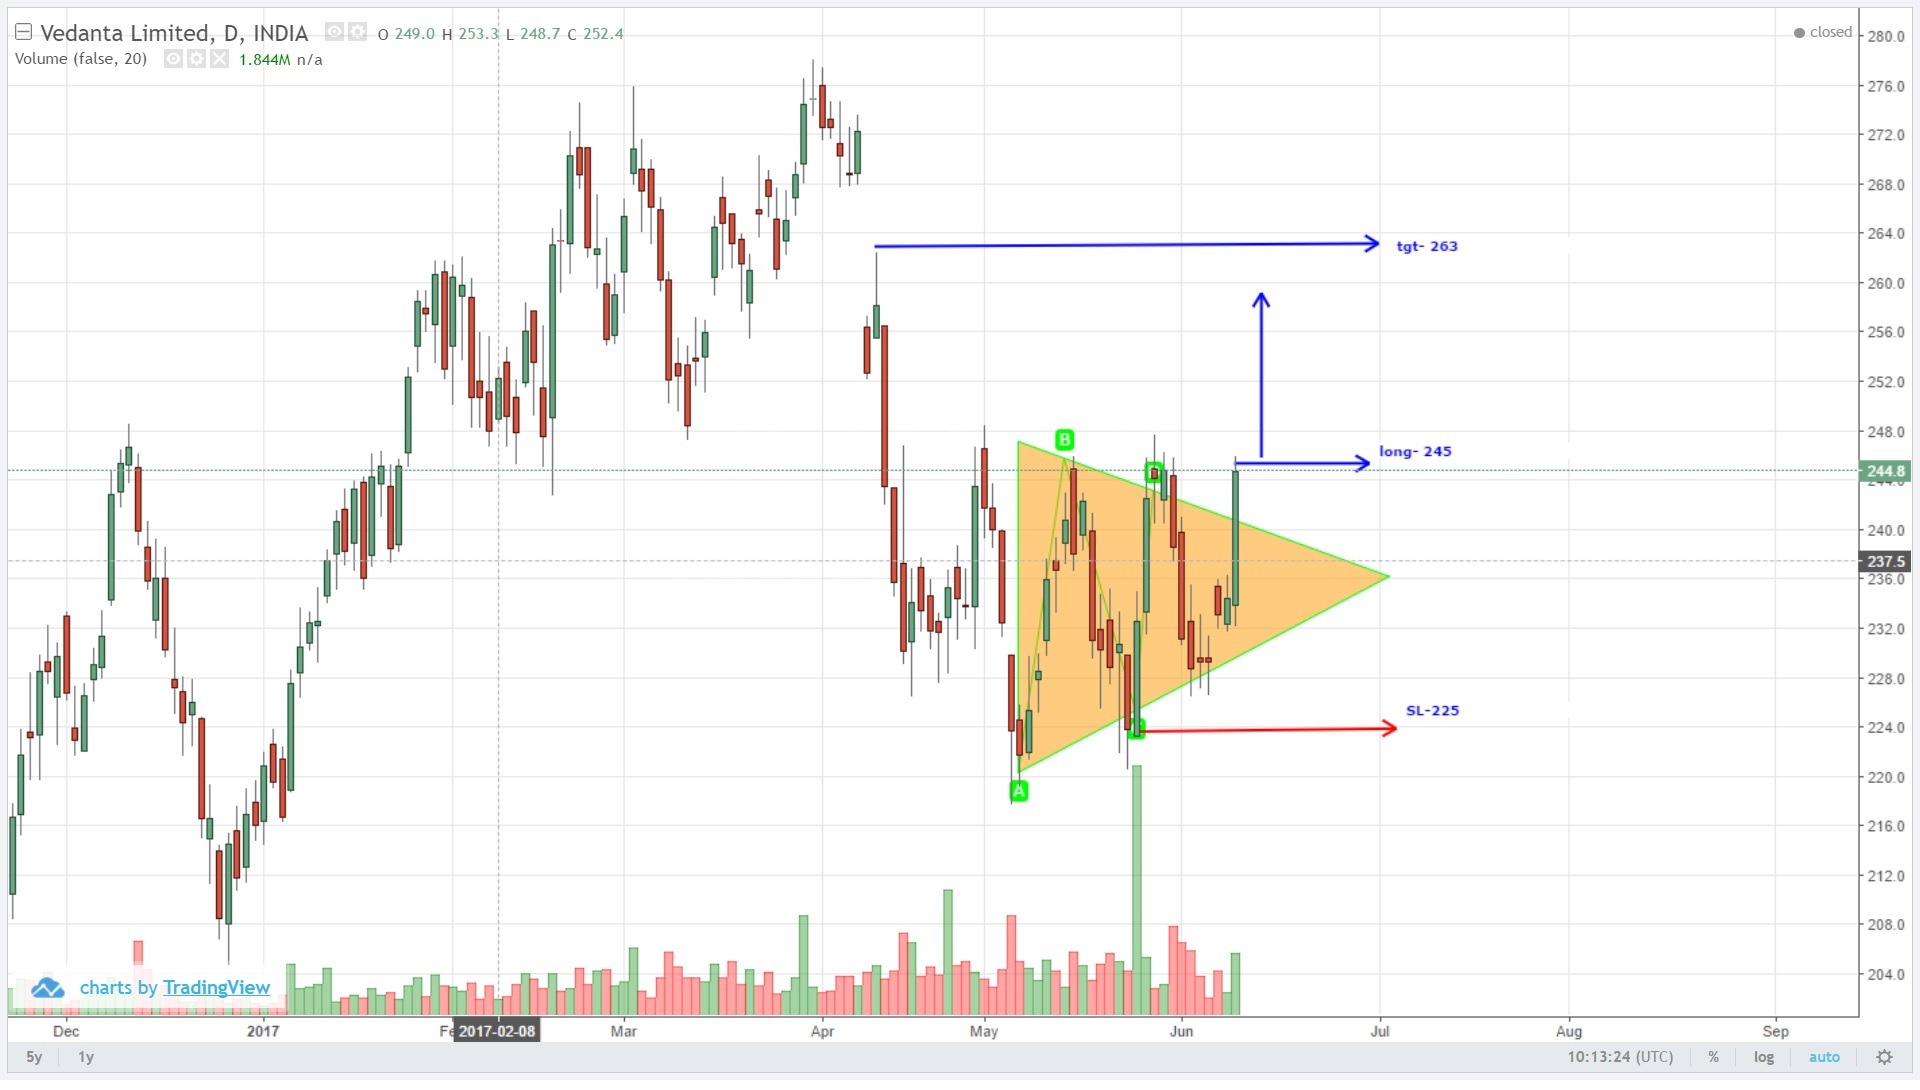
BULLISH TRIANGLE
Bullish . Formation of triangle . Witnessed a 53% Vol change , OI change of 2.4% and price got...
Recently Active Members
Bullish View


Bearish View
-
 Bearish-GAP-SHORT-BICON-25-10-2019 October 25, 2019
-
 FEDERAL BANK – BEARISH ENGULFING October 17, 2019
-
 Cummins India – Bearish Engulfing – 24Sep19 September 25, 2019
-
 Day29-Tata Motors DVR – Bearish Piercing – 12Sep19 September 12, 2019
-
 Day27-Bearish-Engulfing pattern-Tech Mahindtra-09Sep19 September 10, 2019