
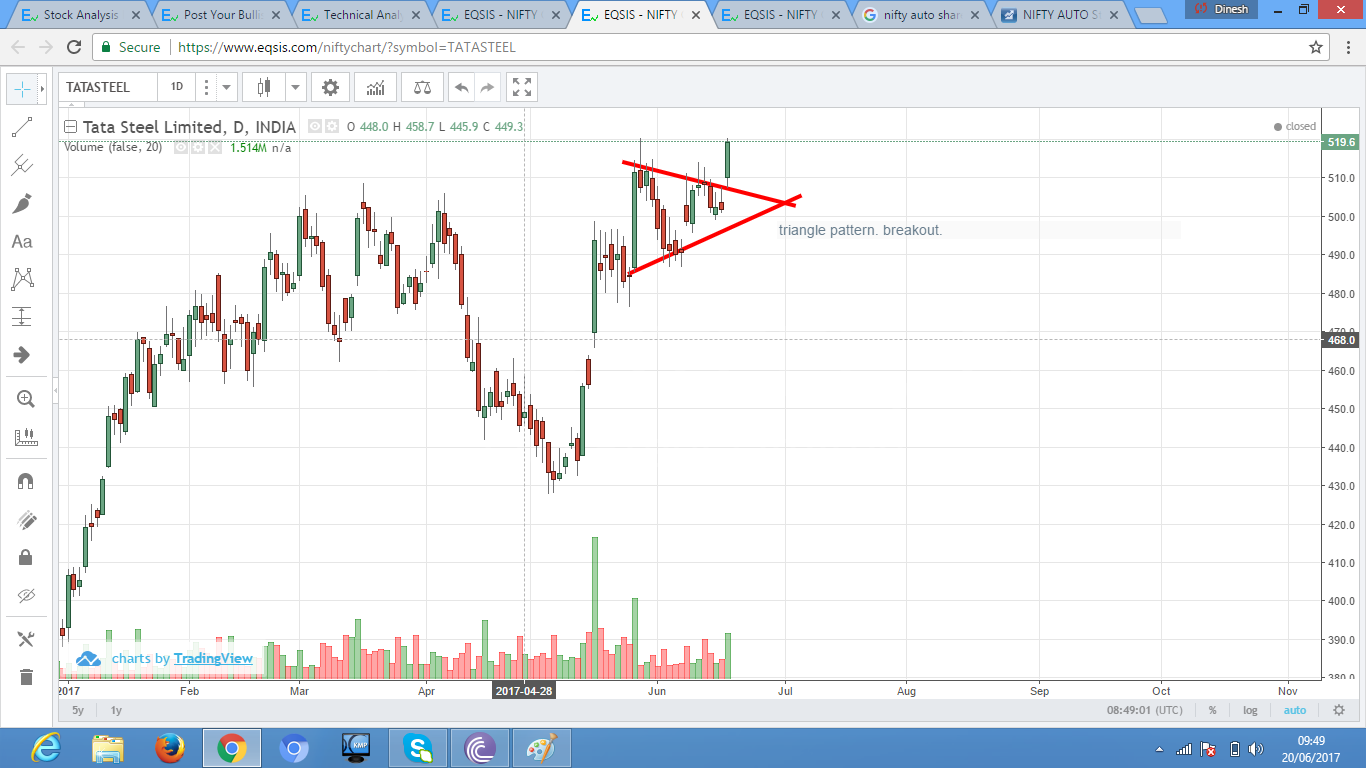
Triangle pattern detected. Pattern with 15 days duration. Bullish Breakout.
BULLISH TRIANGLE
Bullish . Formation of triangle . Witnessed a 53% Vol change , OI change of 2.4% and price got...
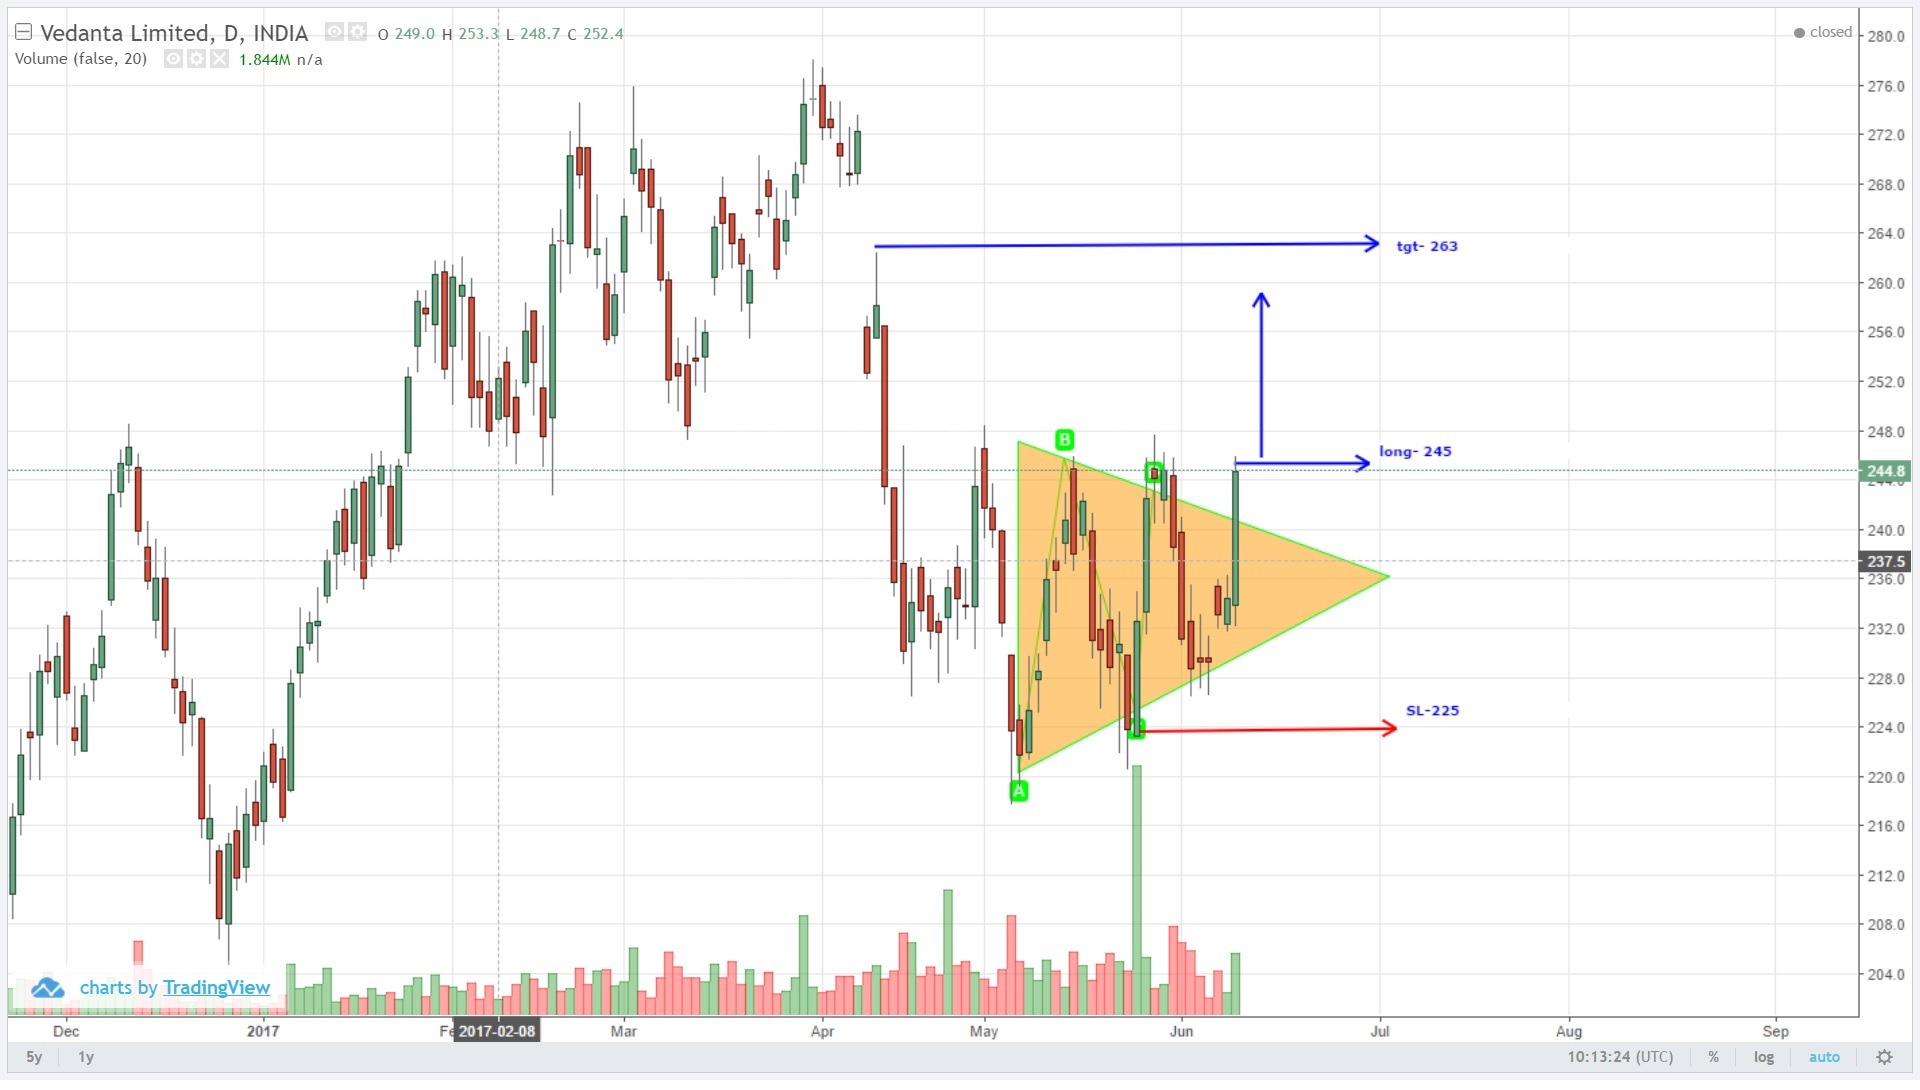
5 Wave corrective pattern,duration nearly 1.5 months,breakout around 70% zone.
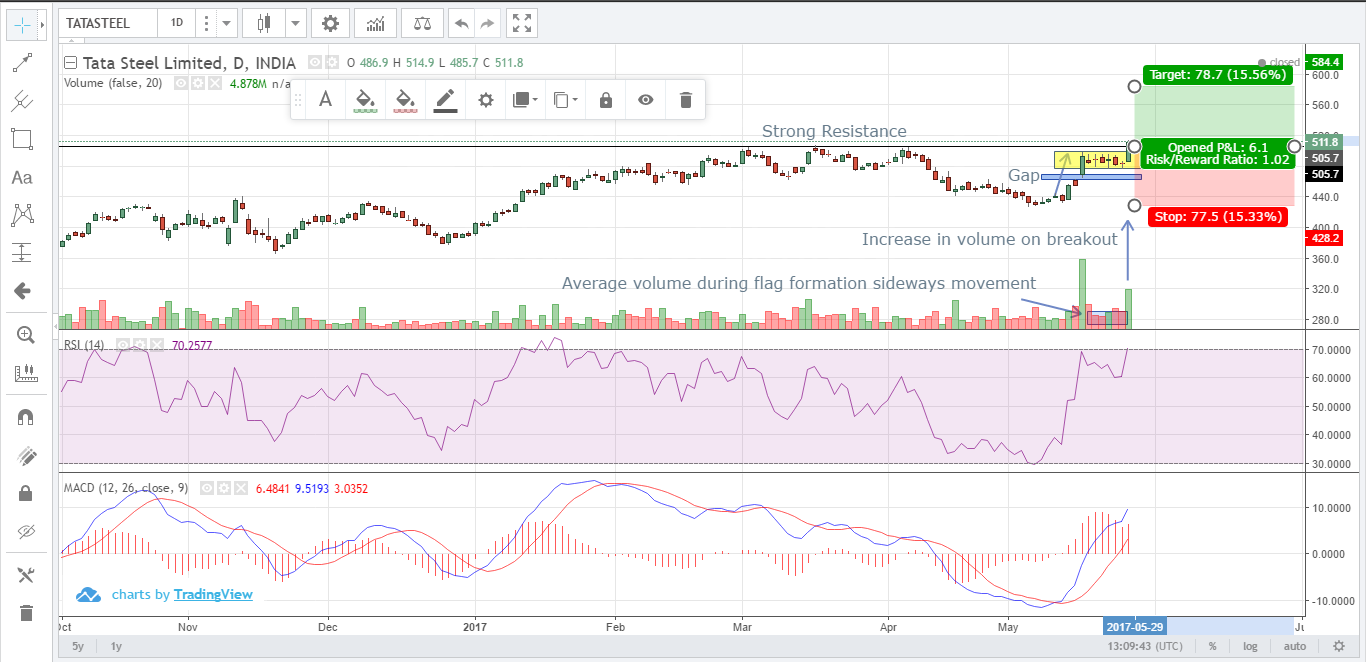
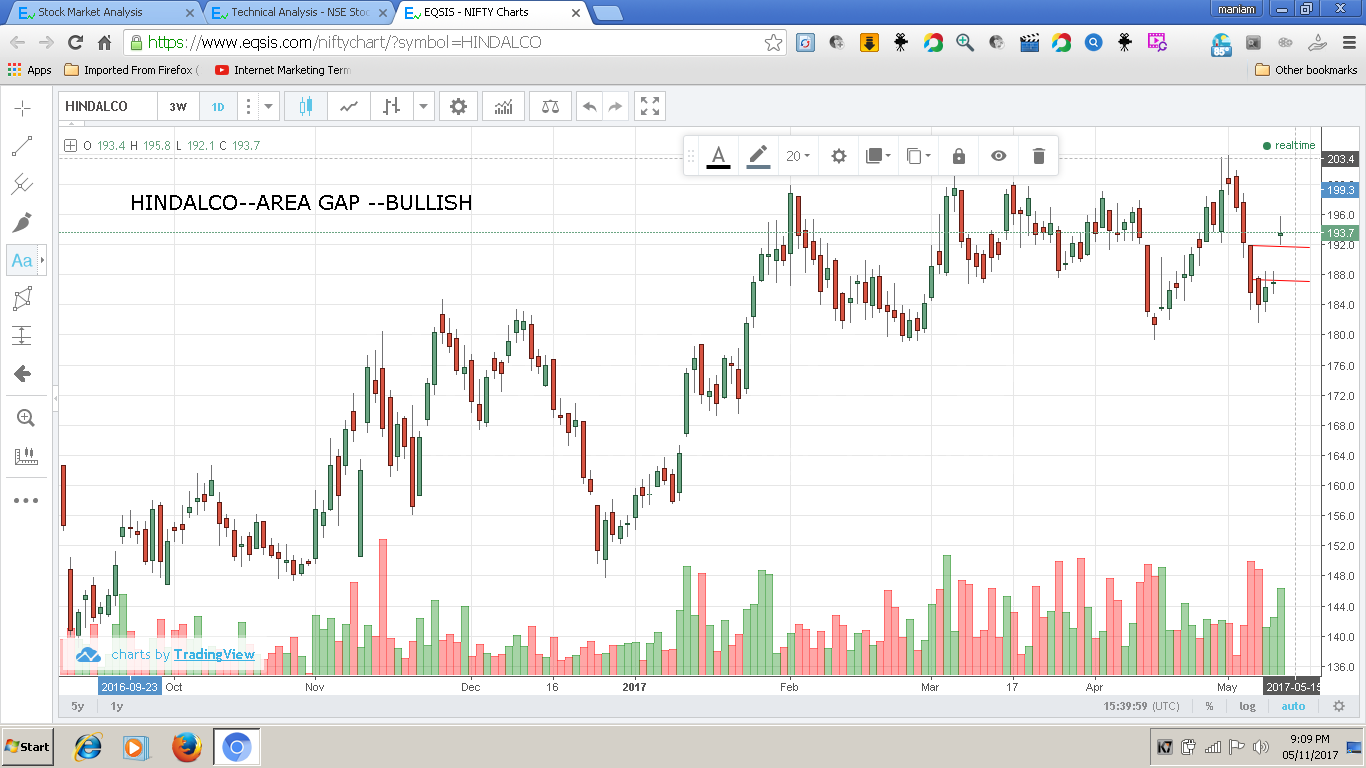
Observed a bullish breakout of a flag pattern formed with very good volume and the sideways movement had an...

Observed a bullish engulfing pattern near the recent support line with good volume on both the days with the...

VEDL formed a hammer pattern at the 23.6 percent retracement line with high deliverable volume. This provides a good...

Script : Hindzinc Buy : 280 Target : 320 Stop Loss : 160 Time : 1 Month

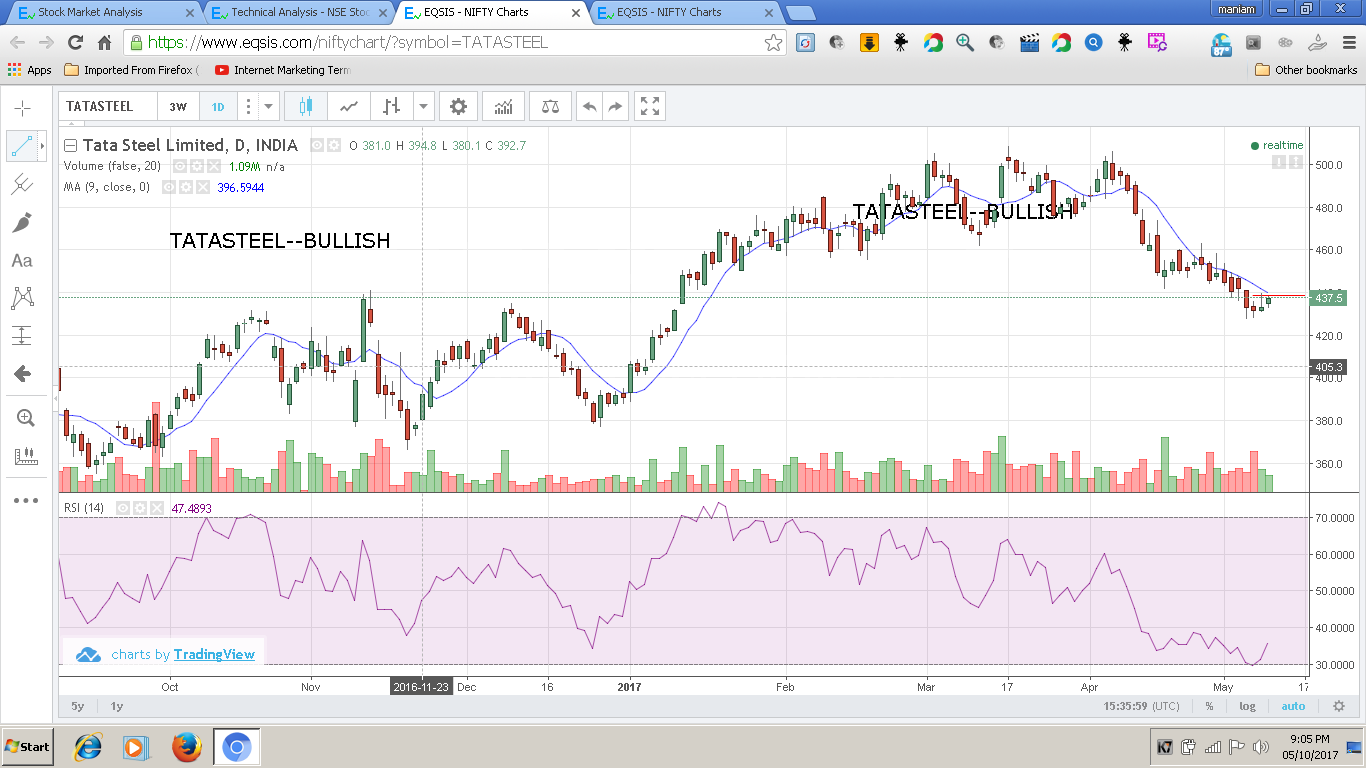
Dow bullish chart can be seen and long positions can be taken above the previous top level. Volume is...
Recently Active Members
Bullish View


Bearish View
-
 Bearish-GAP-SHORT-BICON-25-10-2019 October 25, 2019
-
 FEDERAL BANK – BEARISH ENGULFING October 17, 2019
-
 Cummins India – Bearish Engulfing – 24Sep19 September 25, 2019
-
 Day29-Tata Motors DVR – Bearish Piercing – 12Sep19 September 12, 2019
-
 Day27-Bearish-Engulfing pattern-Tech Mahindtra-09Sep19 September 10, 2019