
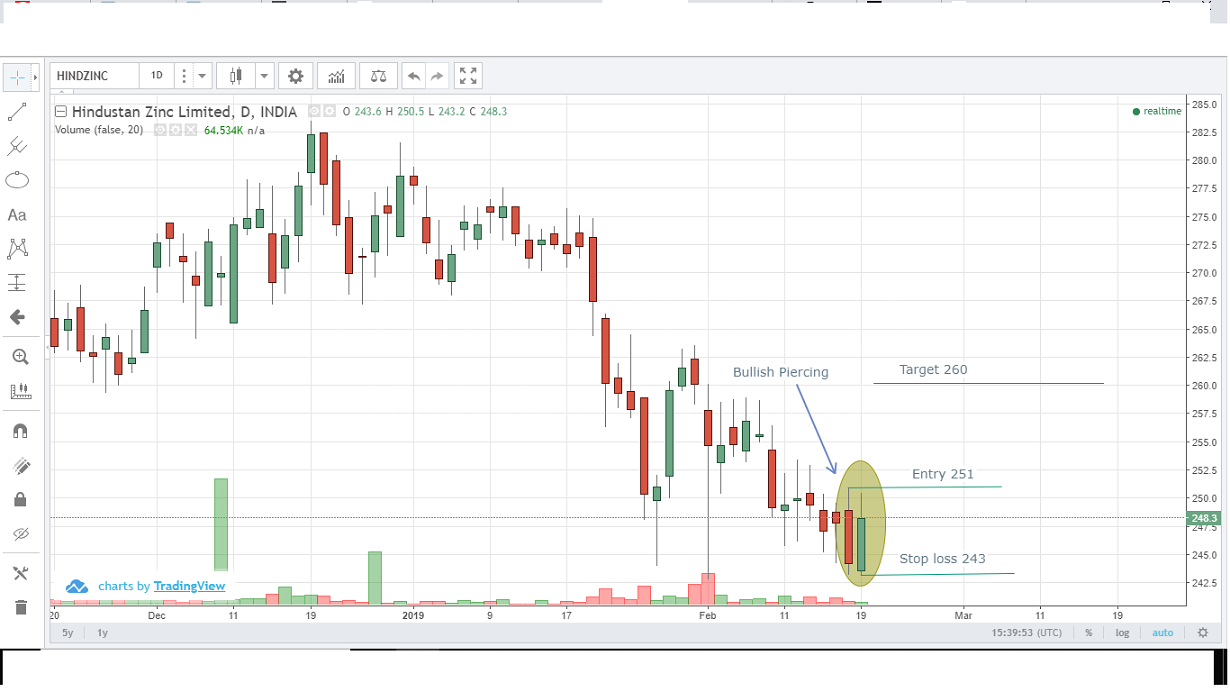
We can see Bullish Piercing candlestick pattern in Hindustan Zinc also we can see recent price fall before this...
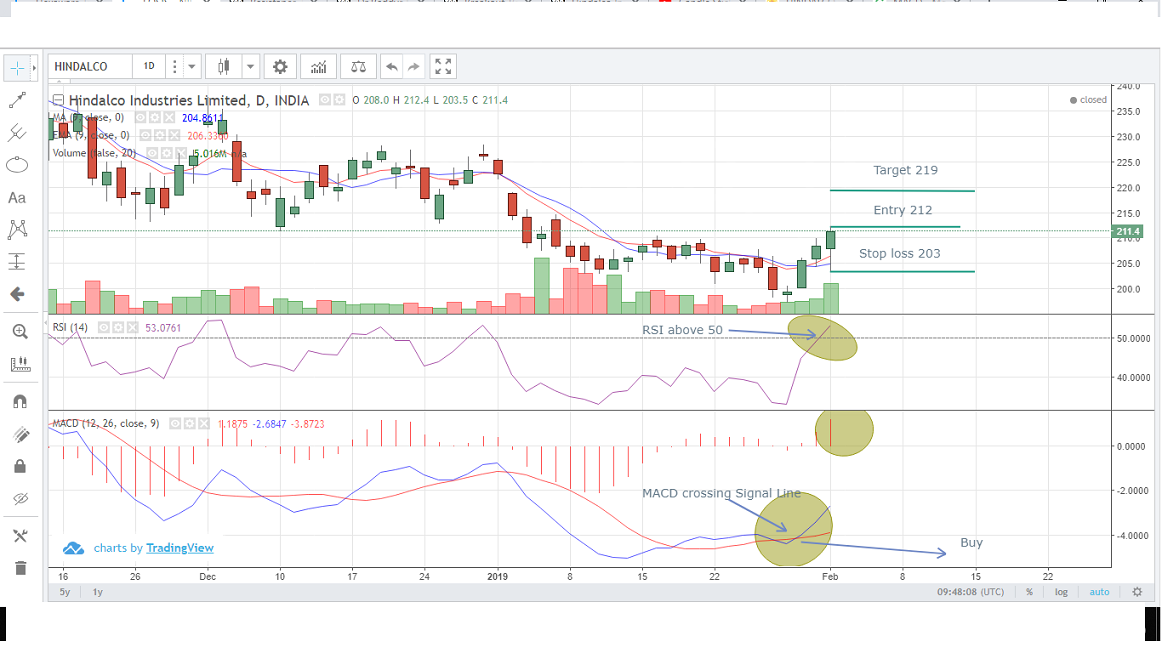
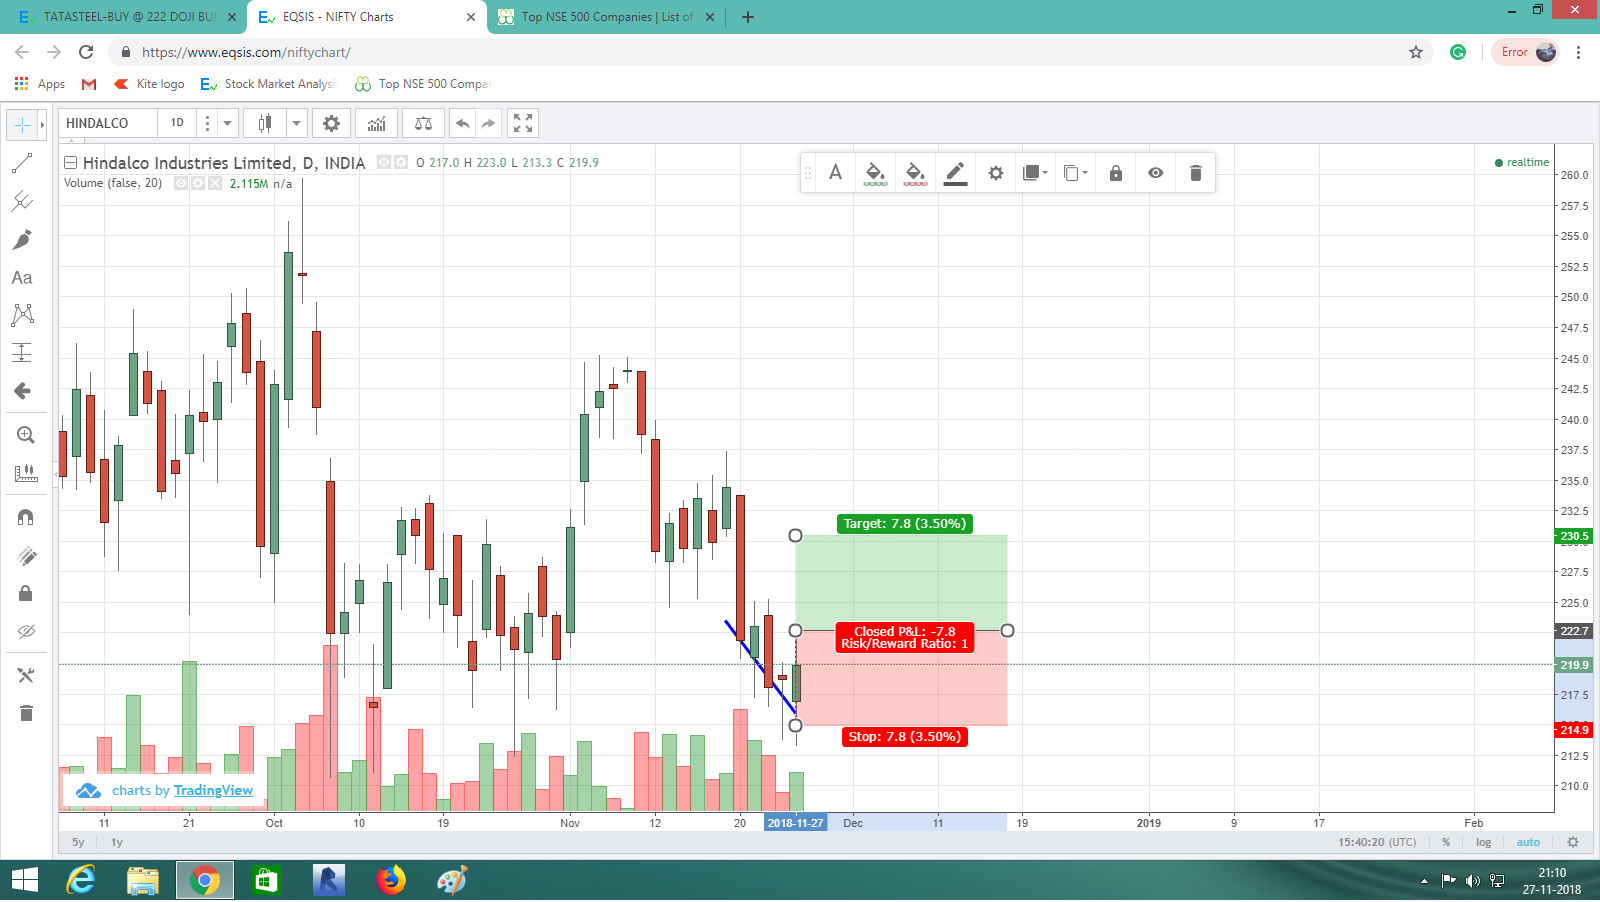
HINDALCO trading above Resistance level with good volume and also we can see MACD (blue line) crosses above the...
THE LATEST GREEN BODY COVERS THE PREVIOUS DAY RED BODY WITH A SIGNIFICANT PRICE DOWN ON THE PREVIOUS DAYS...
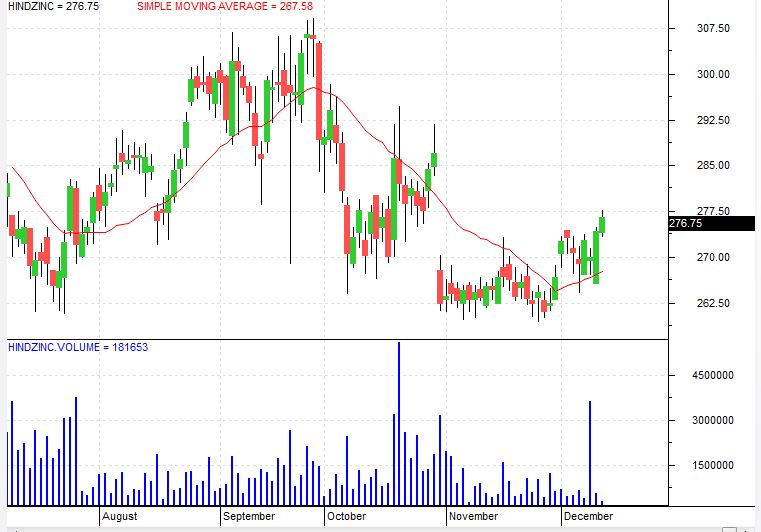
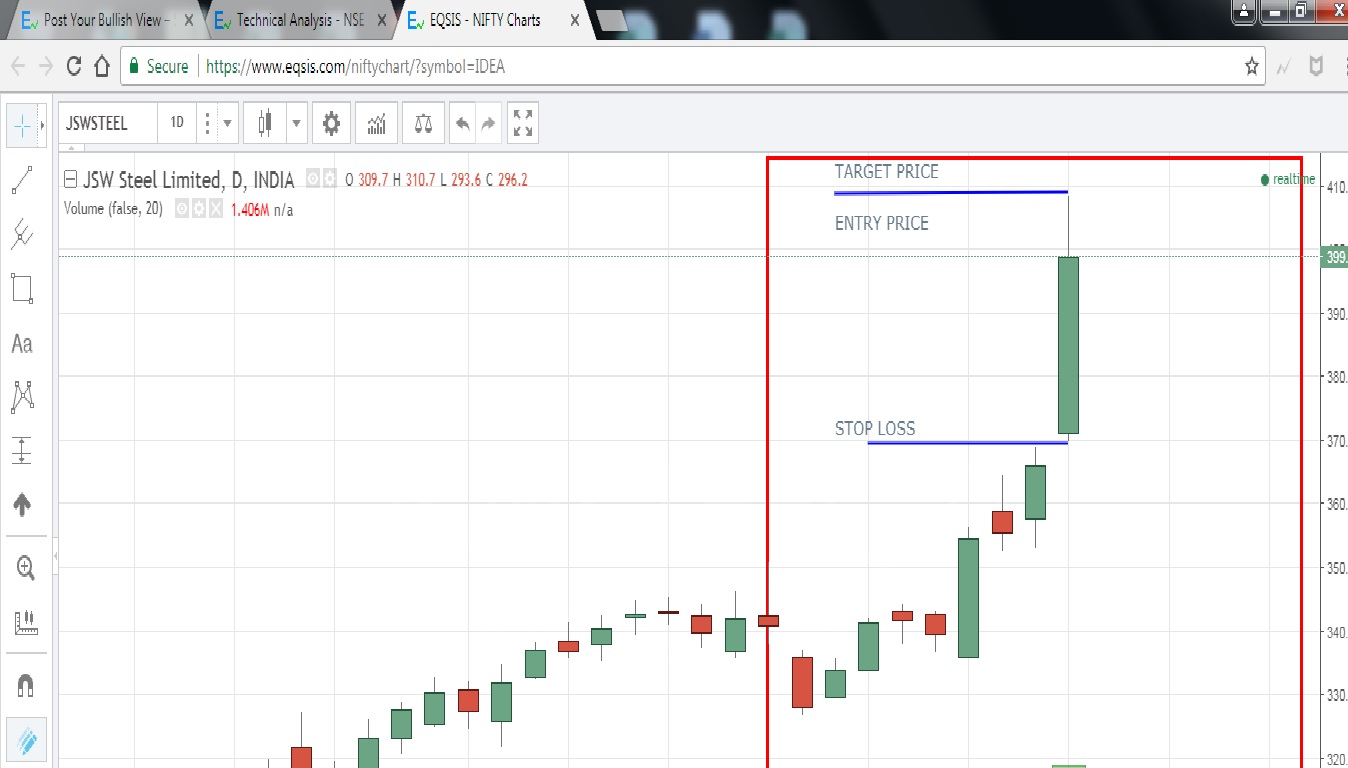
This stock is trading higher at 277 and this scrip was consolidating over a month after the area...
1.steep slope 2.today’s body entirely covered the previous day’ body 3. avg volume

There is bullish view with high volume
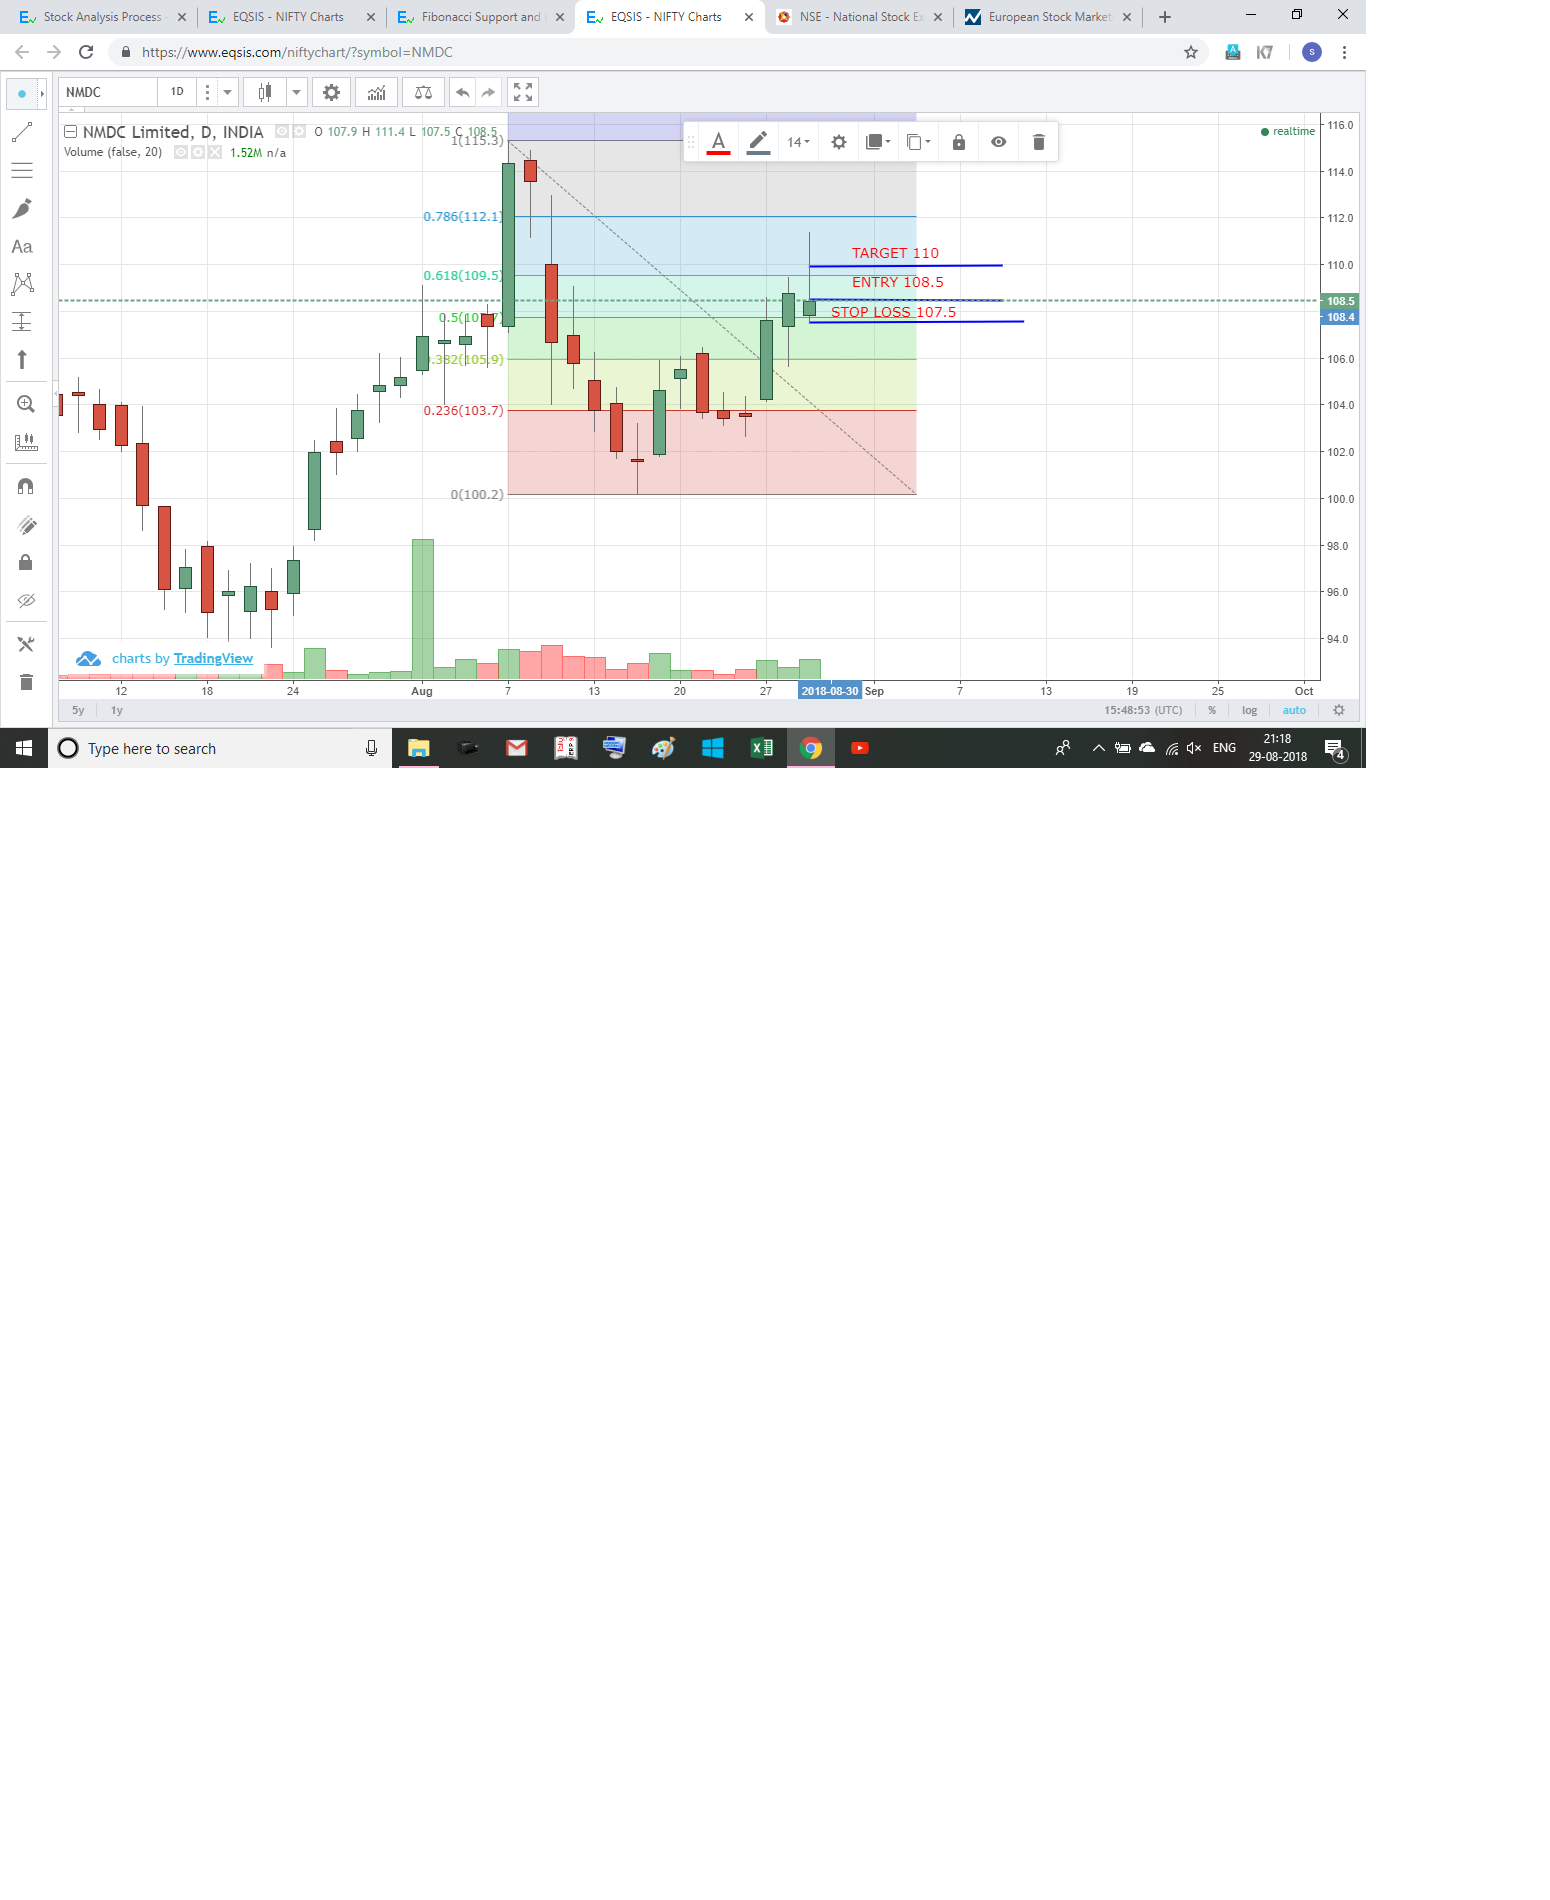
AS I LOOK THE FIB RETRACEMENT CROSS THE 38% IT INDICATES IT MAY CROSS THE 61%
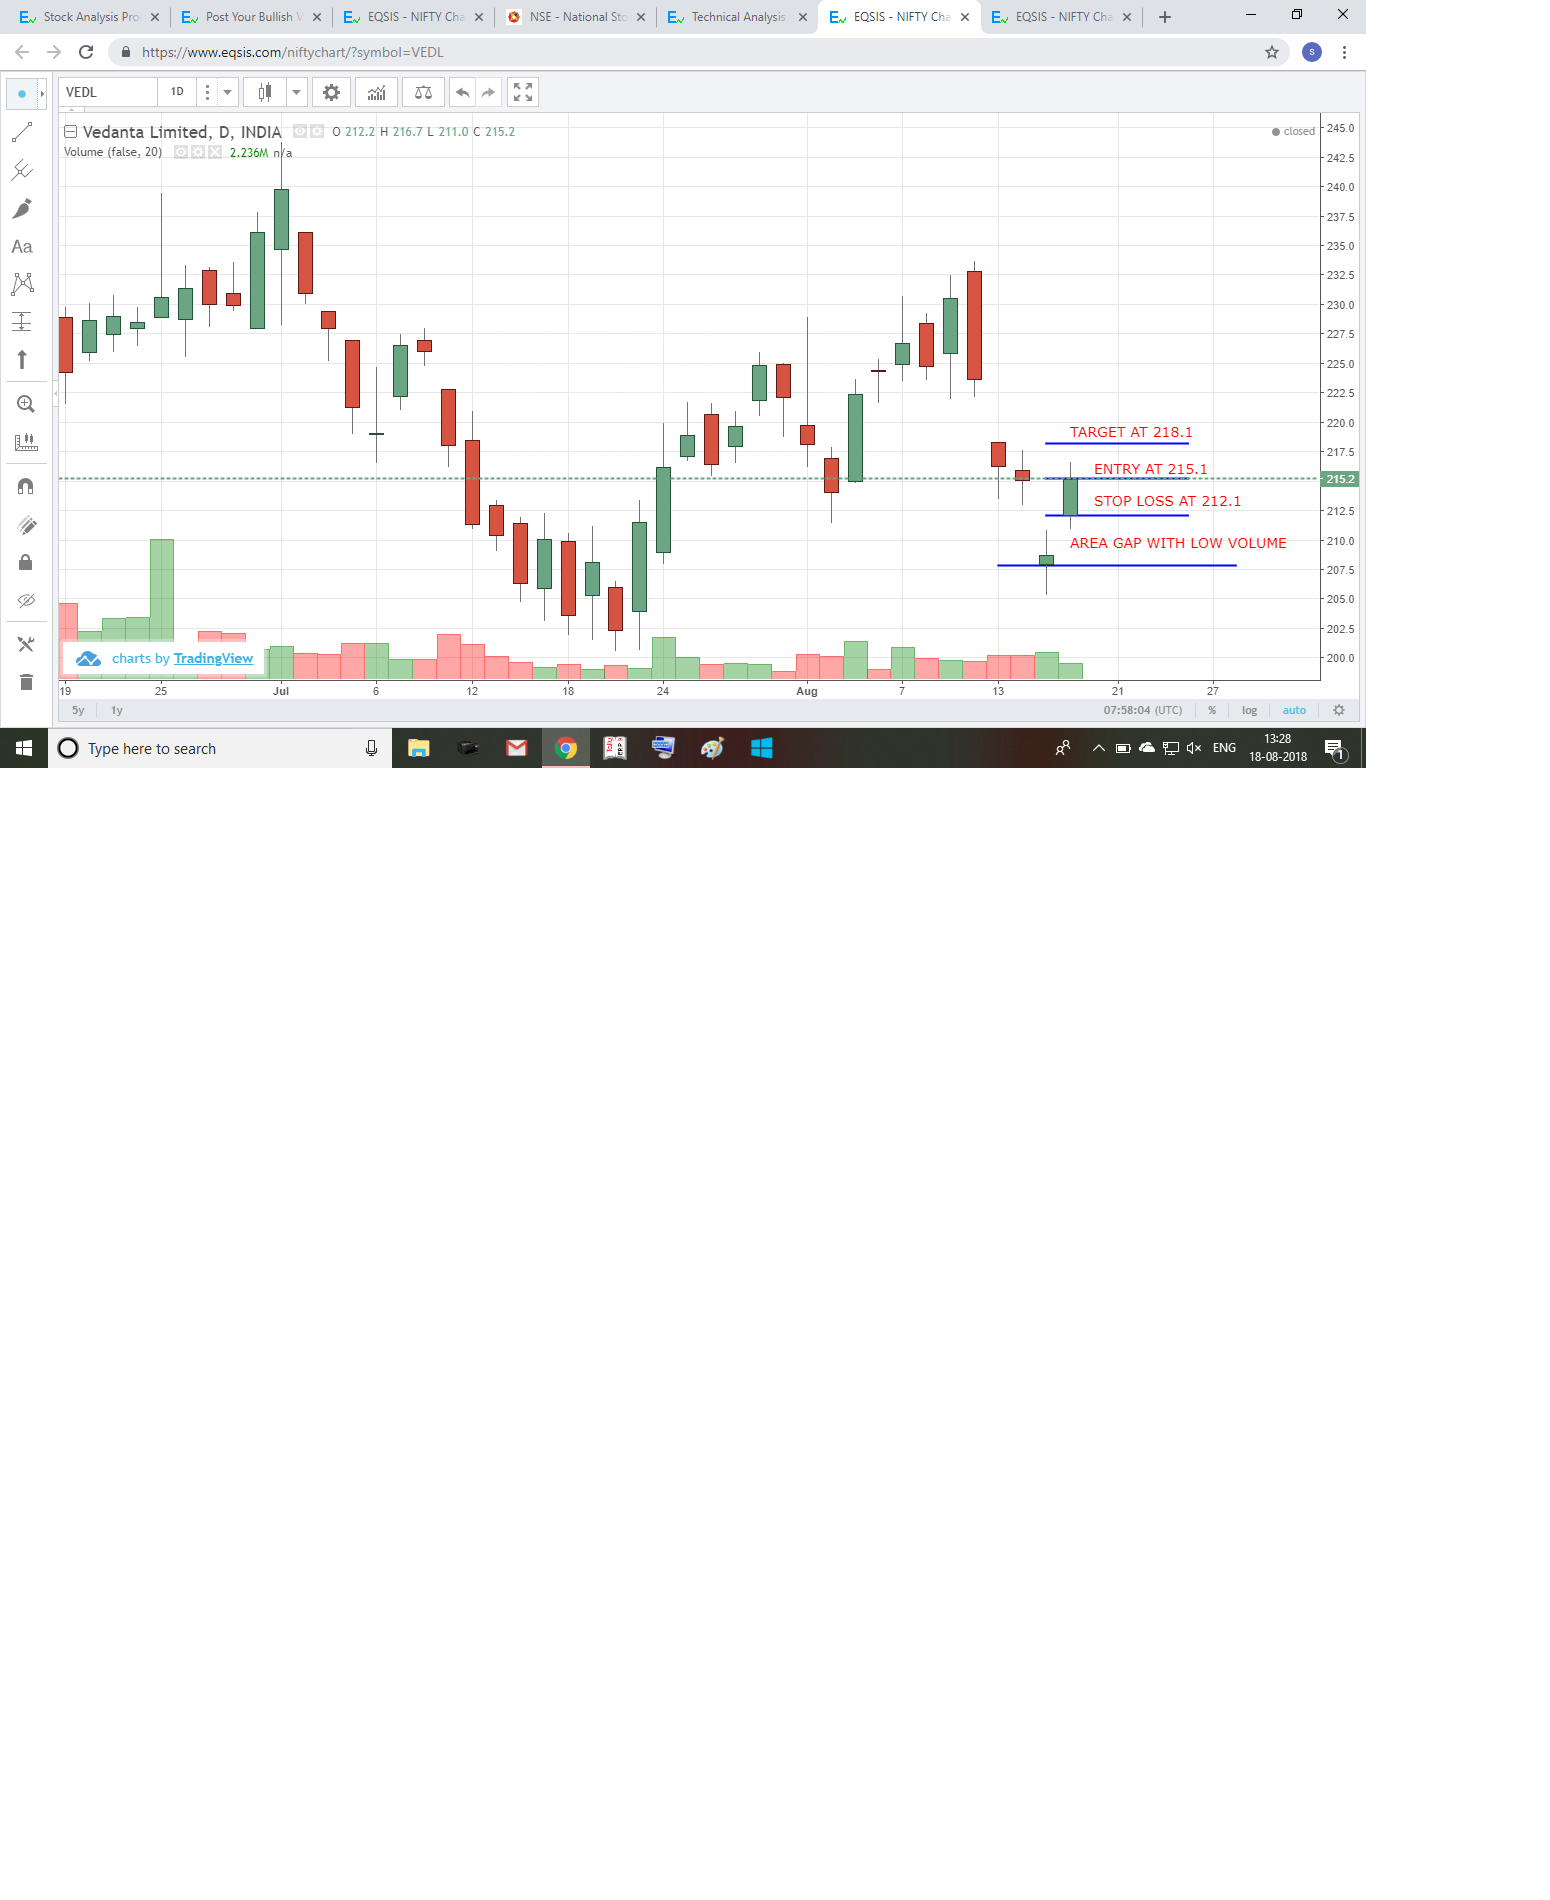
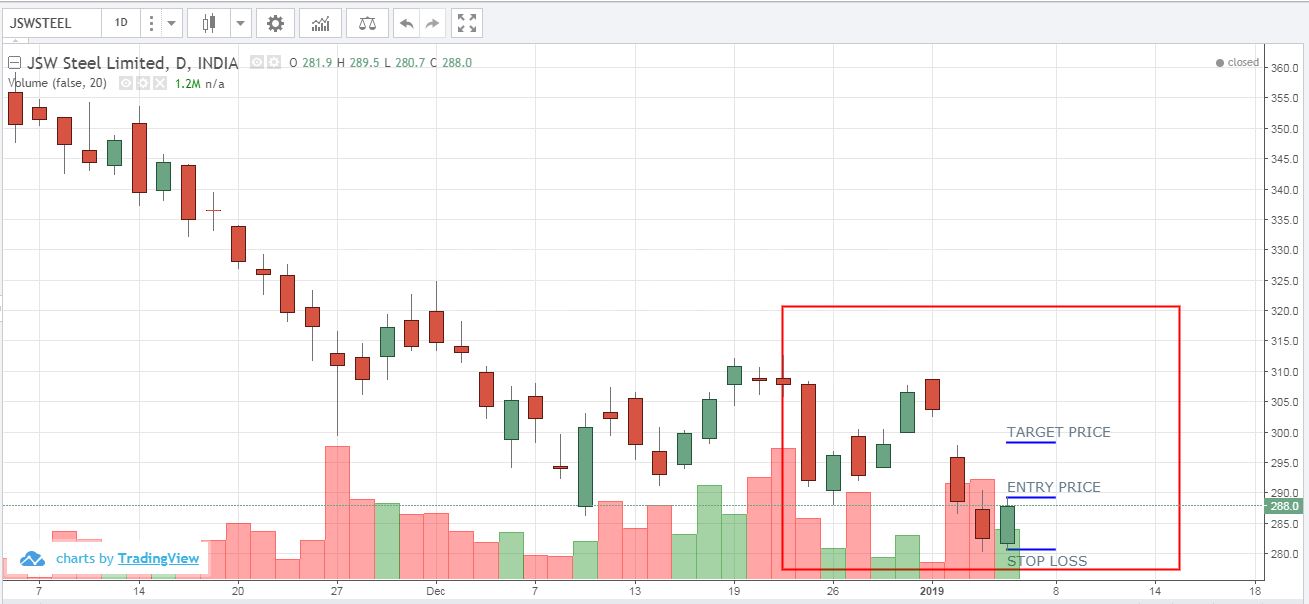
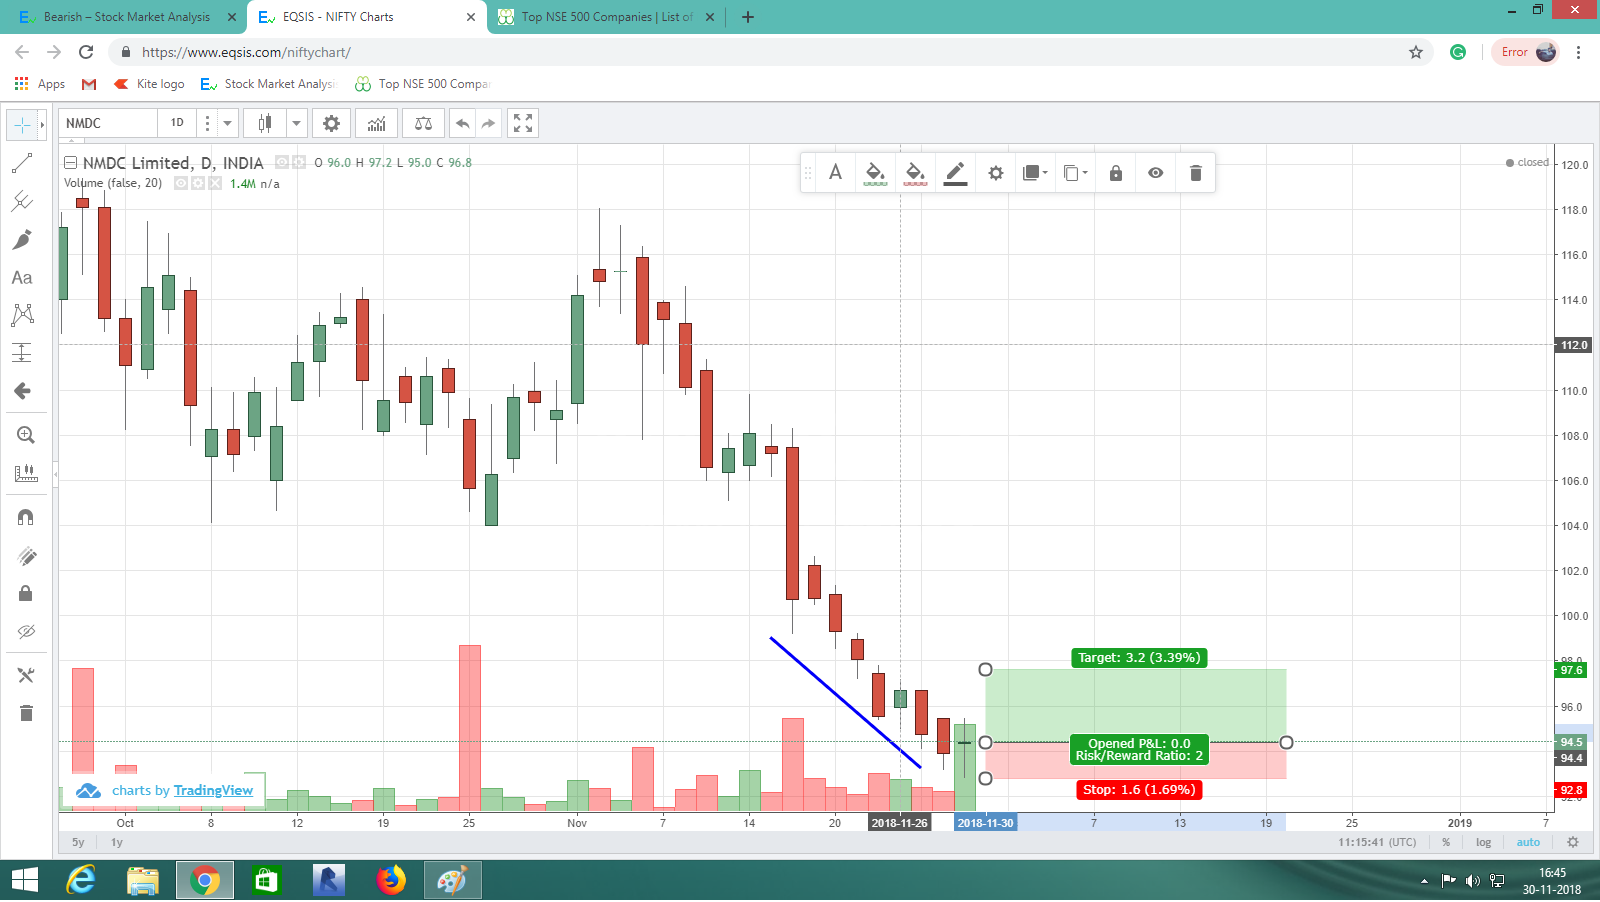
As i look area gap with low volume after price fall and another area gap formed with gap not...
Recently Active Members
Bullish View


Bearish View
-
 Bearish-GAP-SHORT-BICON-25-10-2019 October 25, 2019
-
 FEDERAL BANK – BEARISH ENGULFING October 17, 2019
-
 Cummins India – Bearish Engulfing – 24Sep19 September 25, 2019
-
 Day29-Tata Motors DVR – Bearish Piercing – 12Sep19 September 12, 2019
-
 Day27-Bearish-Engulfing pattern-Tech Mahindtra-09Sep19 September 10, 2019