
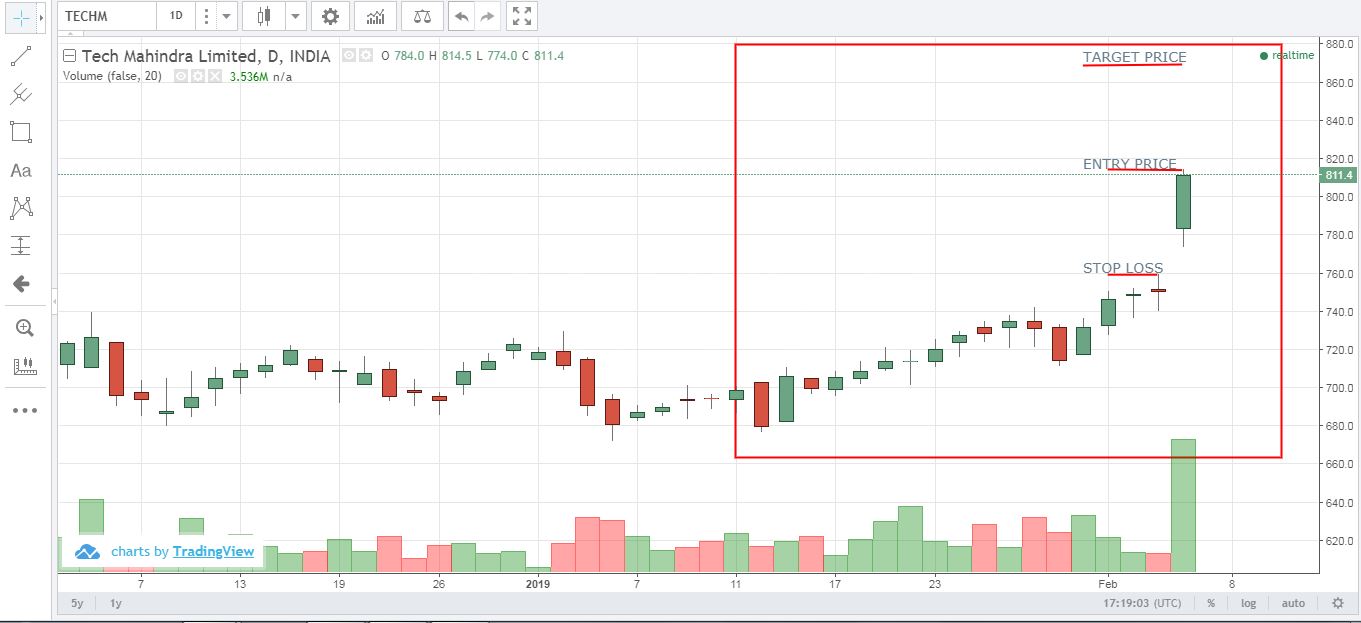
THE STOCK OPENED AT A SIGNIFICANT HIGH COMPARED TO THE PREVIOUS DAY AND HENCE IT QUALIFIES FOR BRAK OUT...
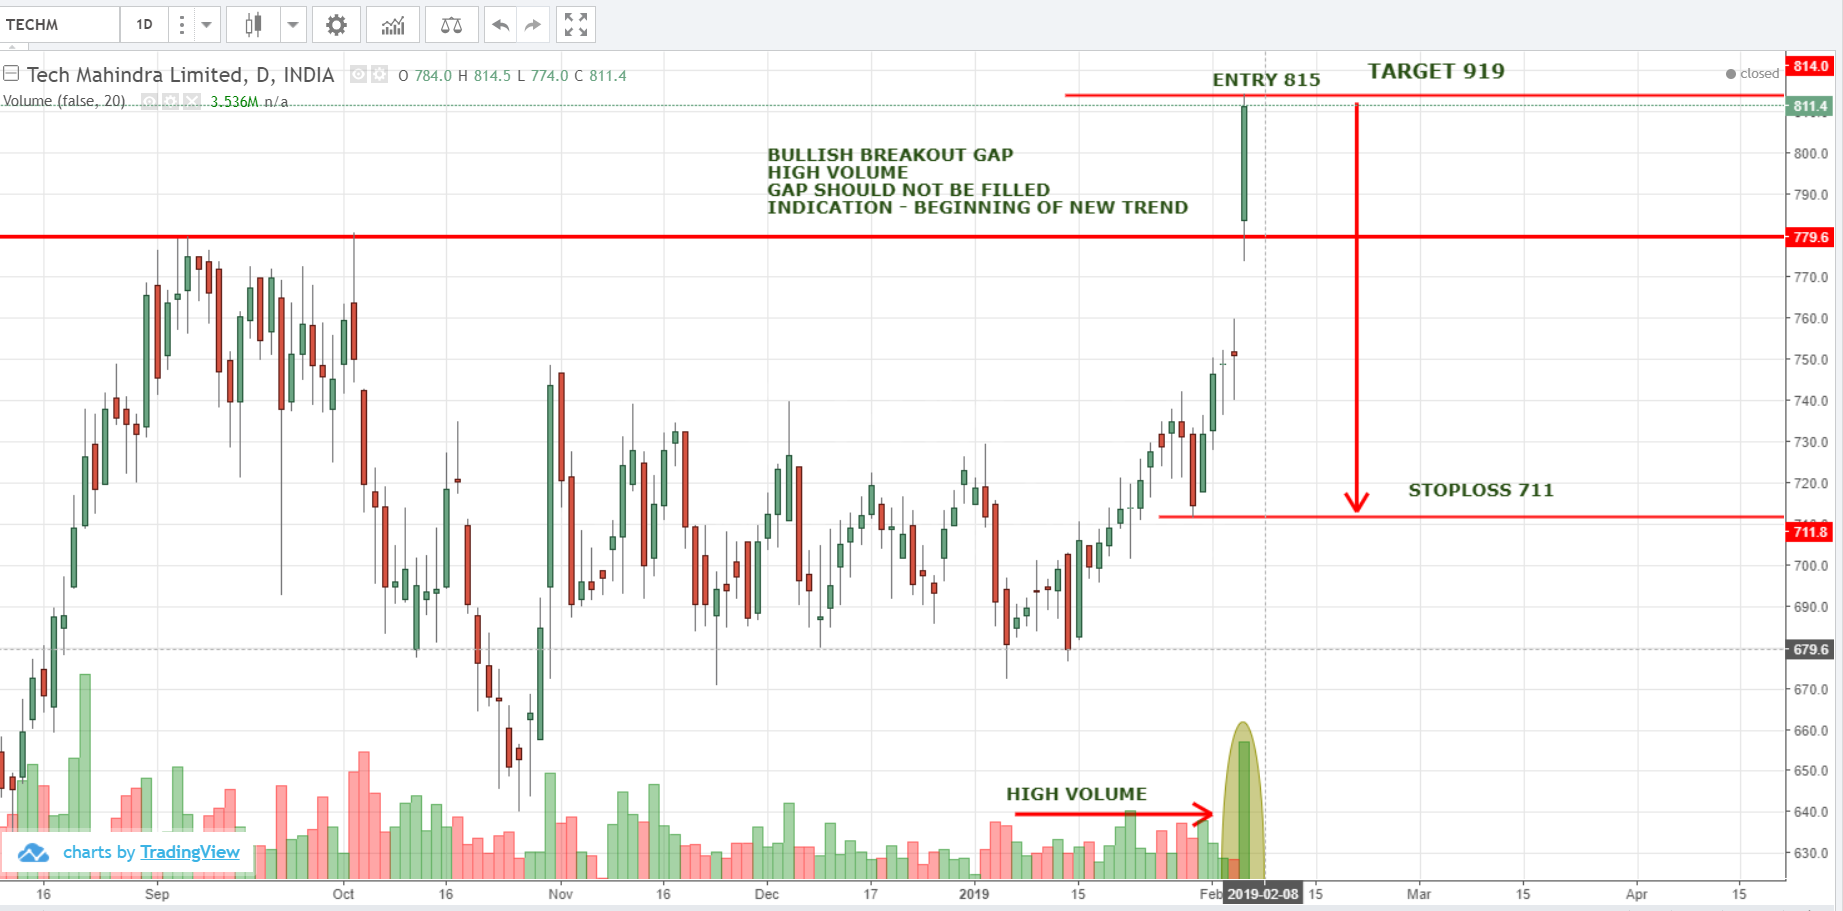
BULLISH BREAKOUT GAP WITH HIGH VOLUME , INDICATION OF BEGINNING OF NEW TREND, GAP SHOULD NOT BE FILLED,
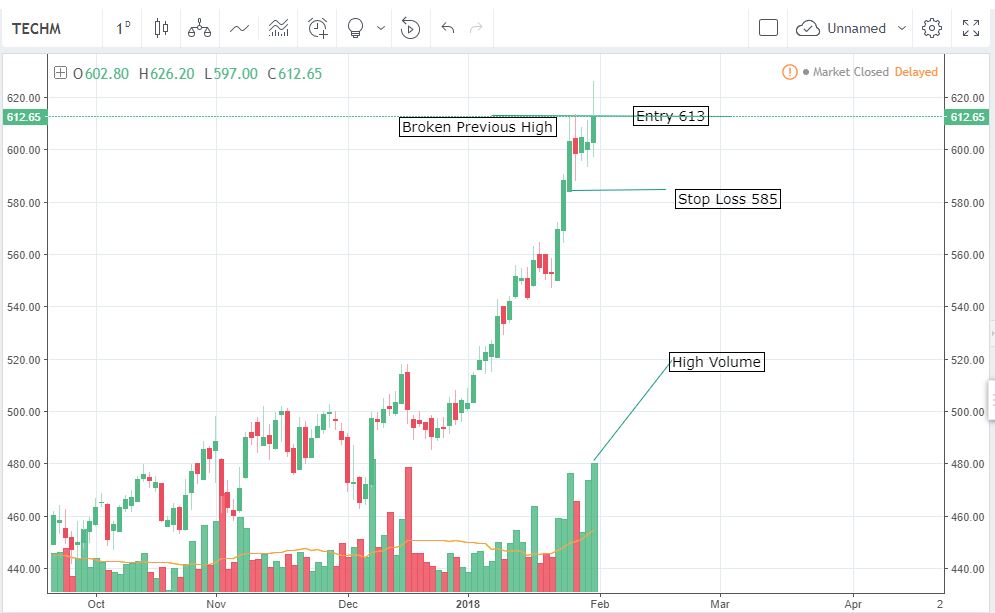
Witnessed bullish flag in TECHM on 31/JAN/2018. ENTRY – 613 SL – 585 Target 641
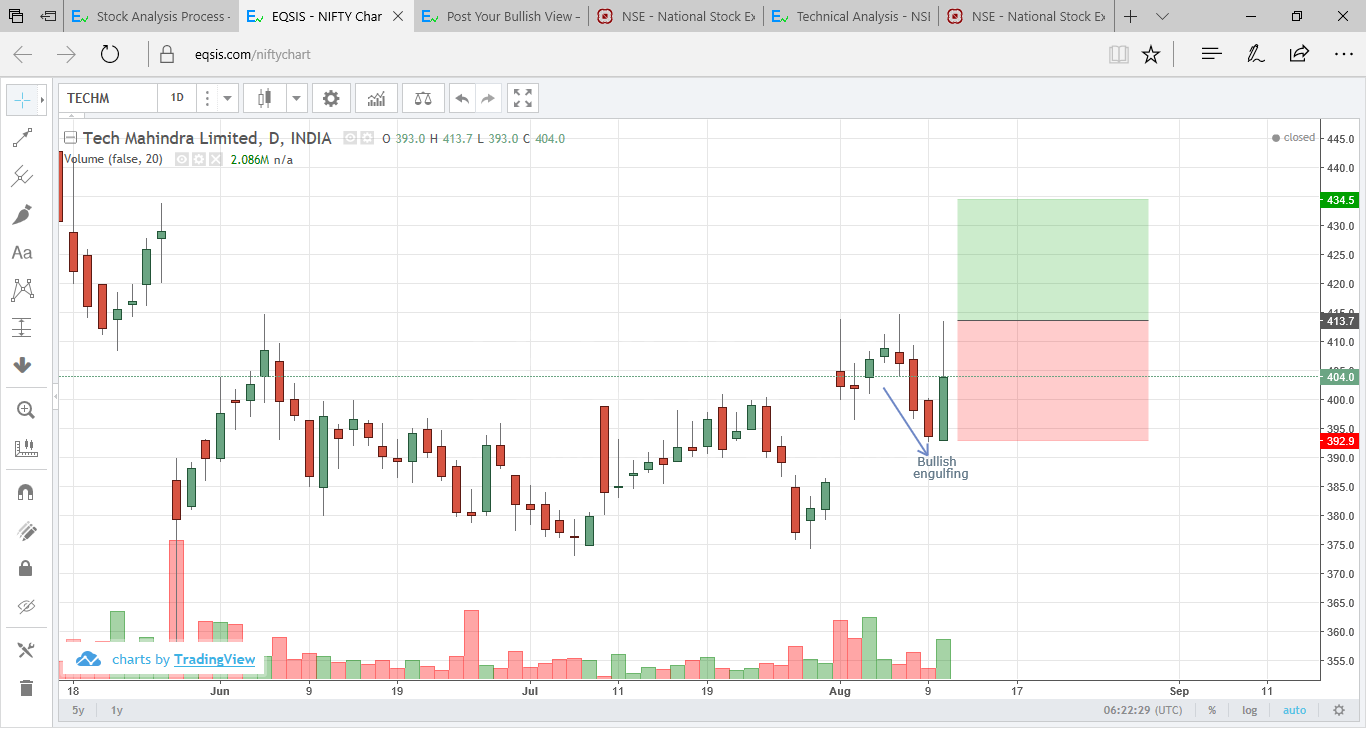
TECHM: Bearish trend followed by bullish engulfing. Volume high in engulfing day. Take long position if price goes above...
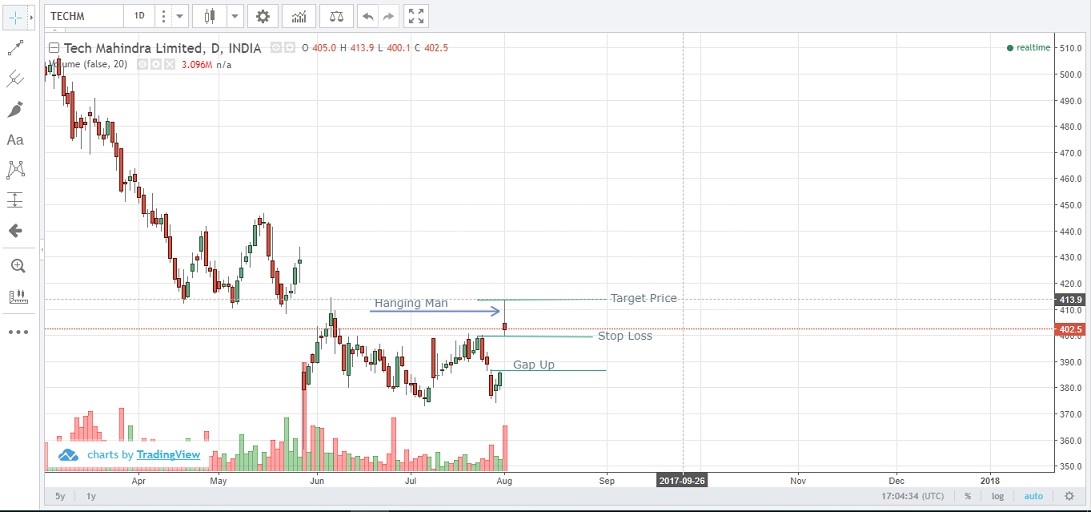
Breakout Gap Seen with a hanging Man Pattern Formation.Volume higher as compare to previous. Indicates Long Position
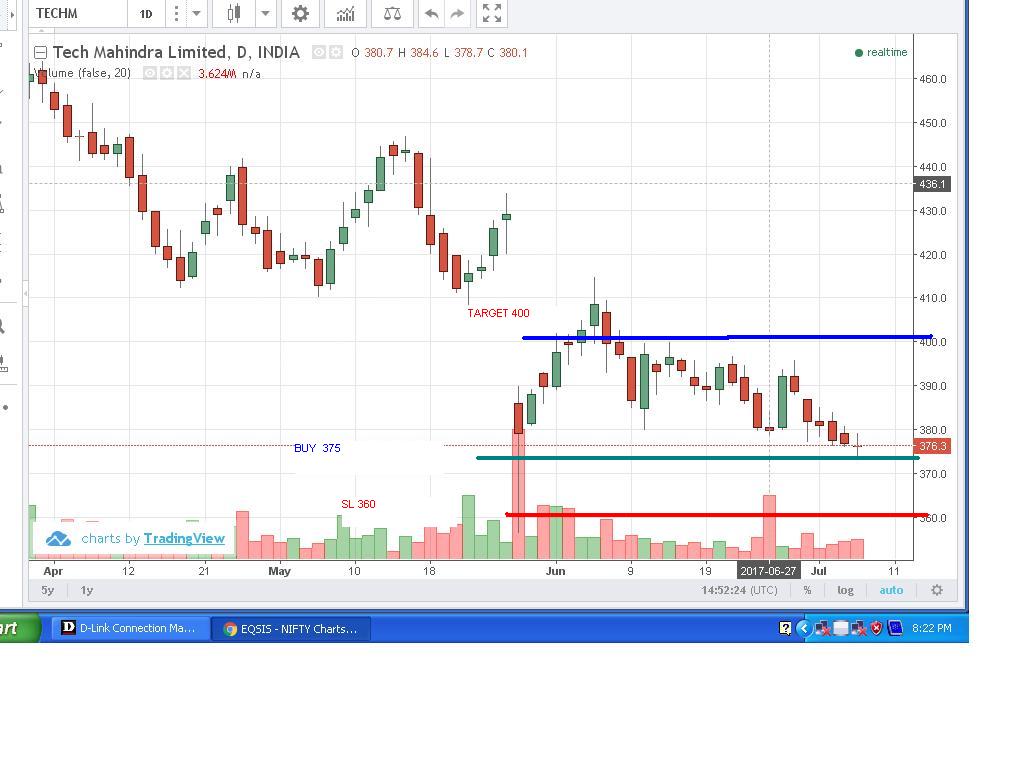
TECHM DOUBLE BOTTOM – DOJI TREND REVERSAL BUY – 375 TARGET – 400 SL -360 DURATION – 7 DAYS
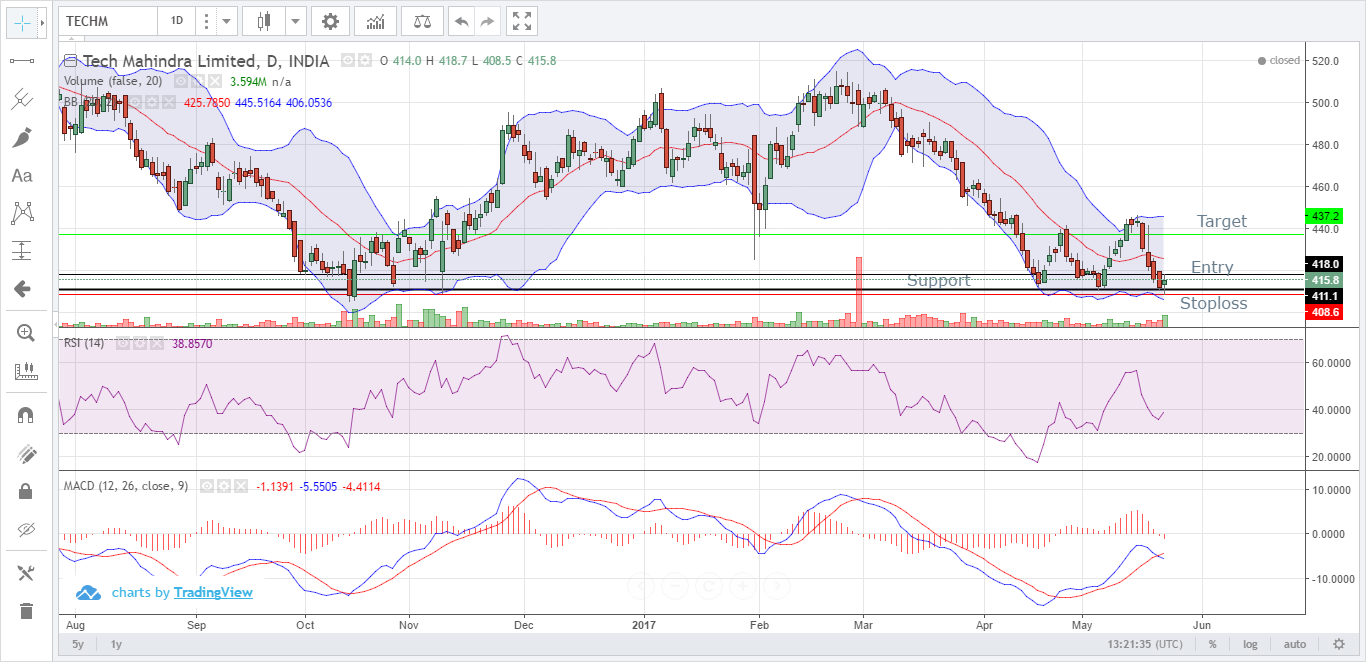
Observed a hammer pattern with good volume.Also, the hammer formation is near the support zone with the prior trend...
Recently Active Members
Bullish View


Bearish View
-
 Bearish-GAP-SHORT-BICON-25-10-2019 October 25, 2019
-
 FEDERAL BANK – BEARISH ENGULFING October 17, 2019
-
 Cummins India – Bearish Engulfing – 24Sep19 September 25, 2019
-
 Day29-Tata Motors DVR – Bearish Piercing – 12Sep19 September 12, 2019
-
 Day27-Bearish-Engulfing pattern-Tech Mahindtra-09Sep19 September 10, 2019