
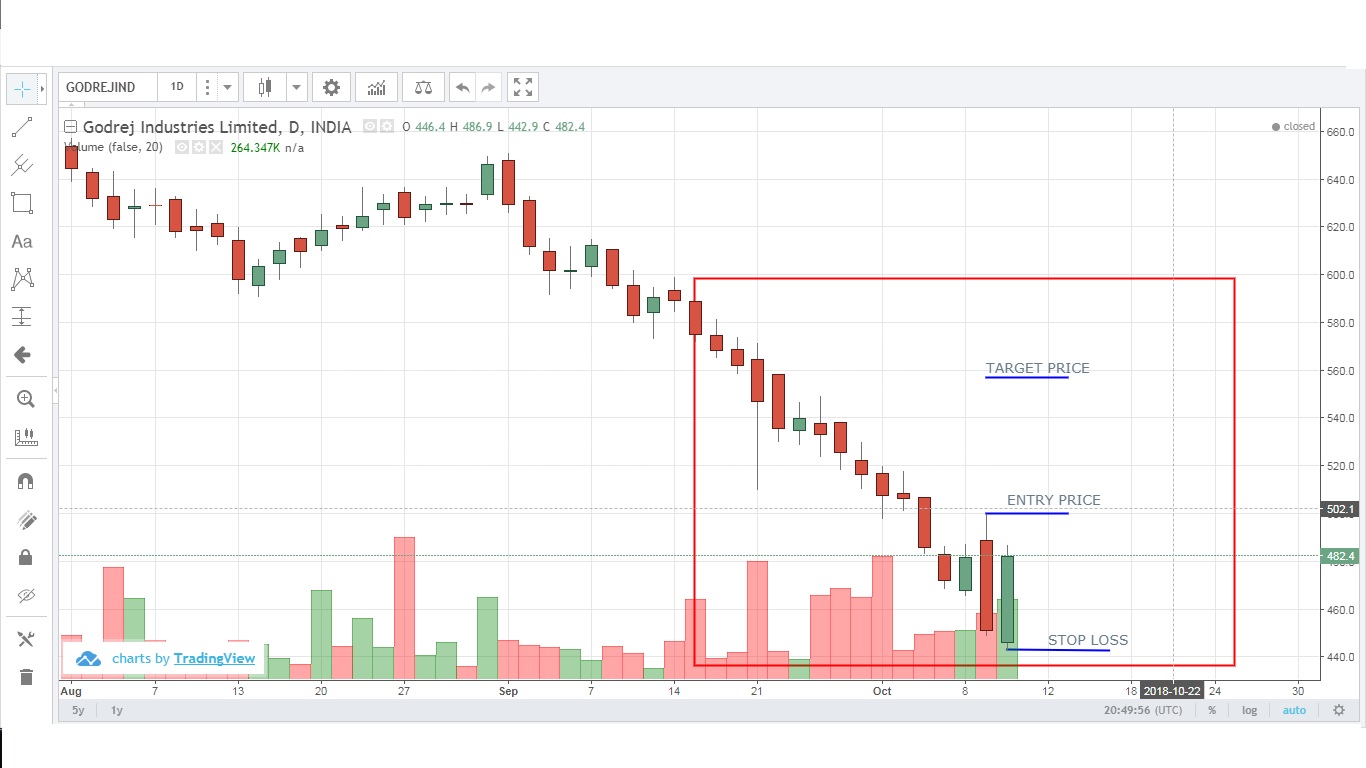
The latest green body covers the previous day low and covers more than 50 % of the red body...
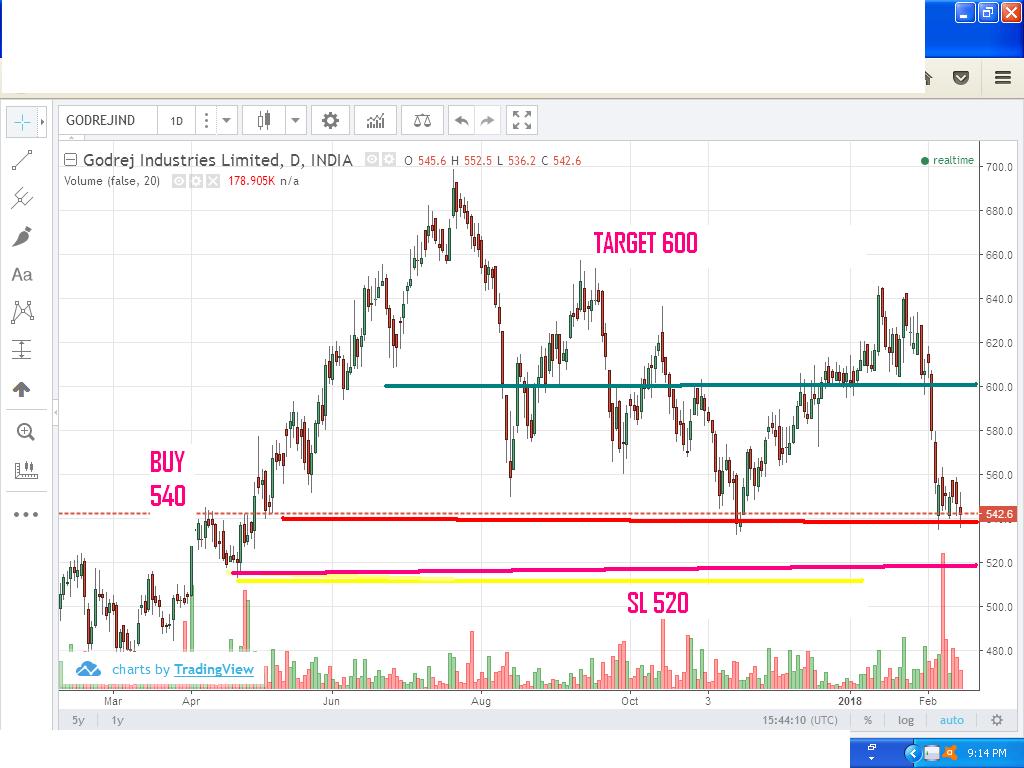
GODREJ INDUSTRIES BUY 540 , TARGET 600, SL : 520 TARGET 15 DAYS
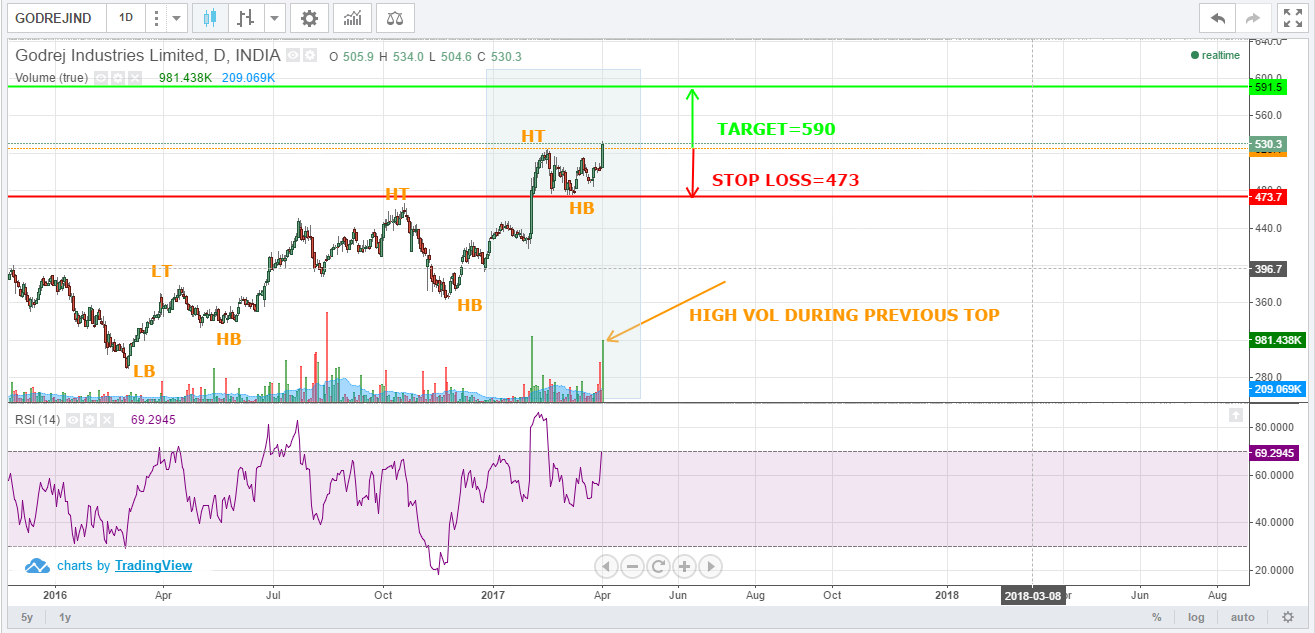
DOW bullish chart pattern can be seen. High volume observed during previous top level. High delivery percentage also indicates...
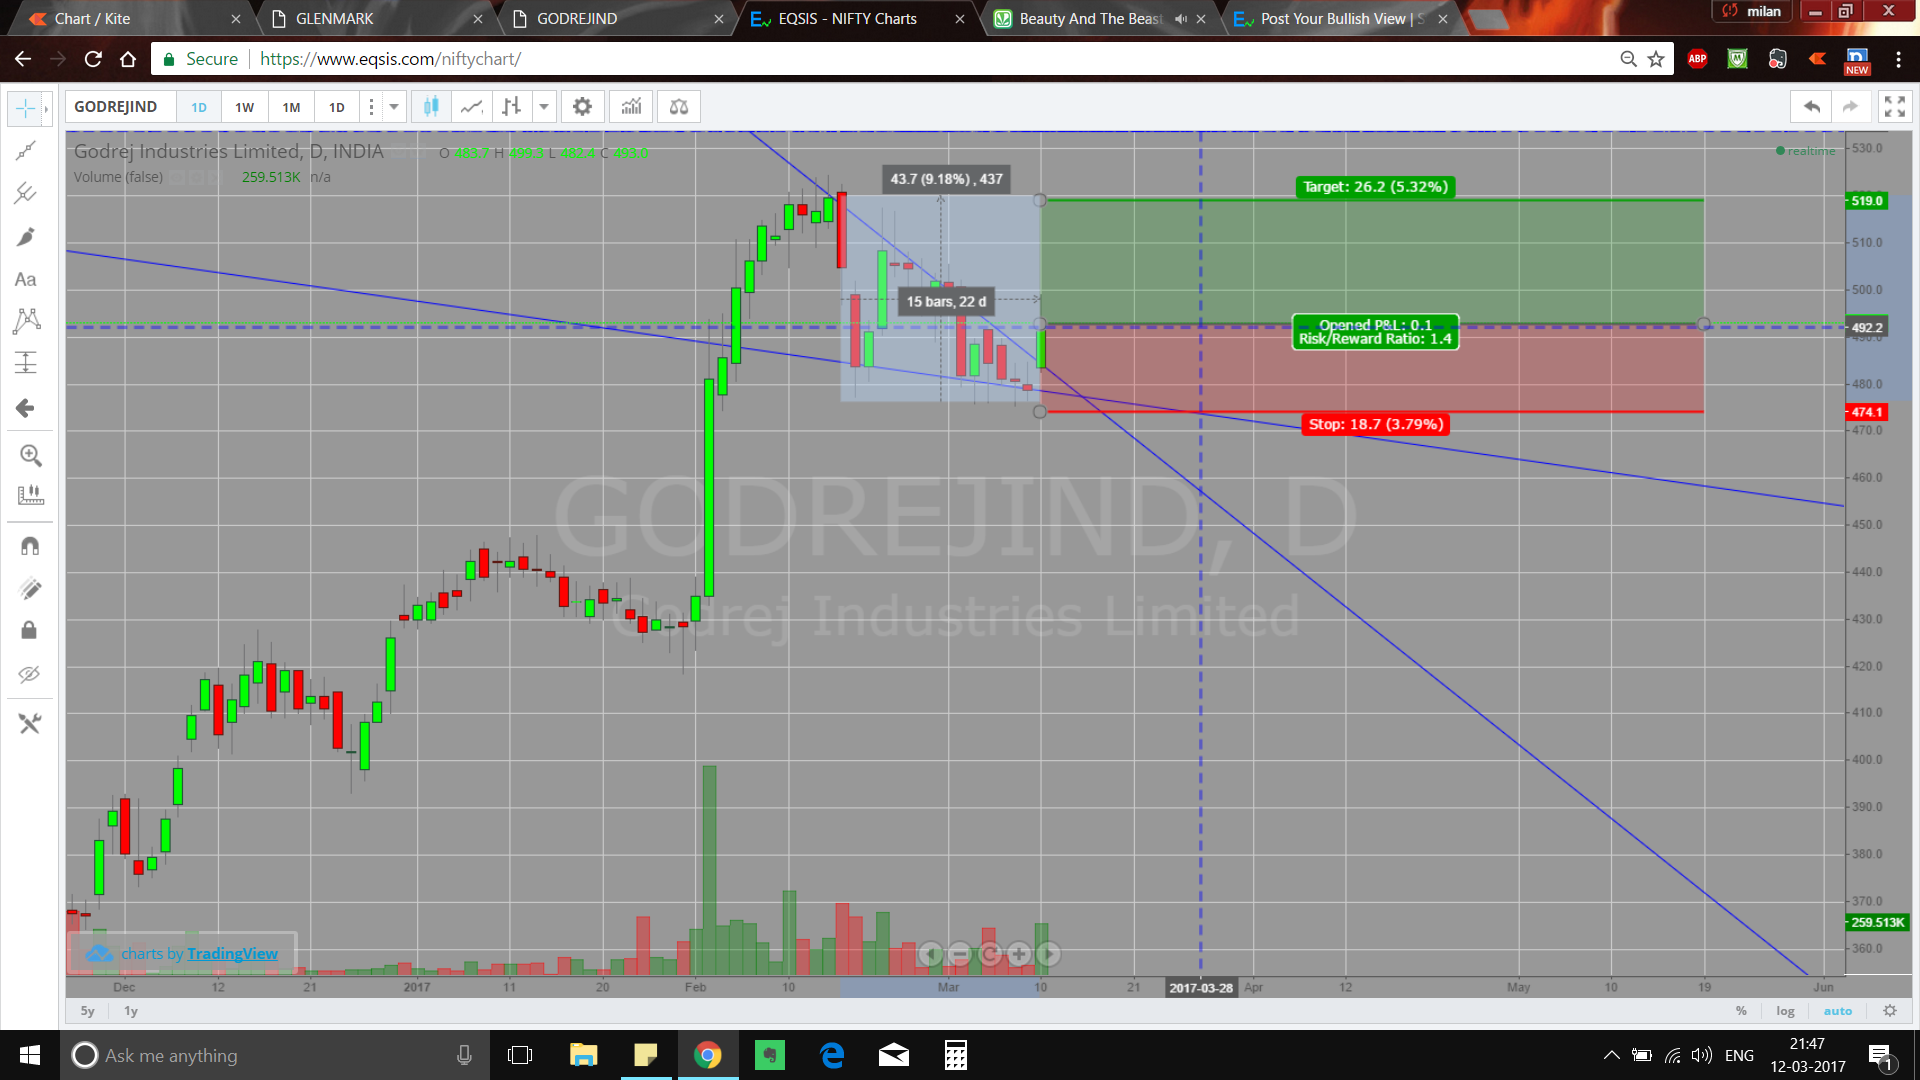
GODREJ share price formed a triangle pattern with good break out volume and an attractive risk to reward ratio....
Recently Active Members
Bullish View


Bearish View
-
 Bearish-GAP-SHORT-BICON-25-10-2019 October 25, 2019
-
 FEDERAL BANK – BEARISH ENGULFING October 17, 2019
-
 Cummins India – Bearish Engulfing – 24Sep19 September 25, 2019
-
 Day29-Tata Motors DVR – Bearish Piercing – 12Sep19 September 12, 2019
-
 Day27-Bearish-Engulfing pattern-Tech Mahindtra-09Sep19 September 10, 2019