
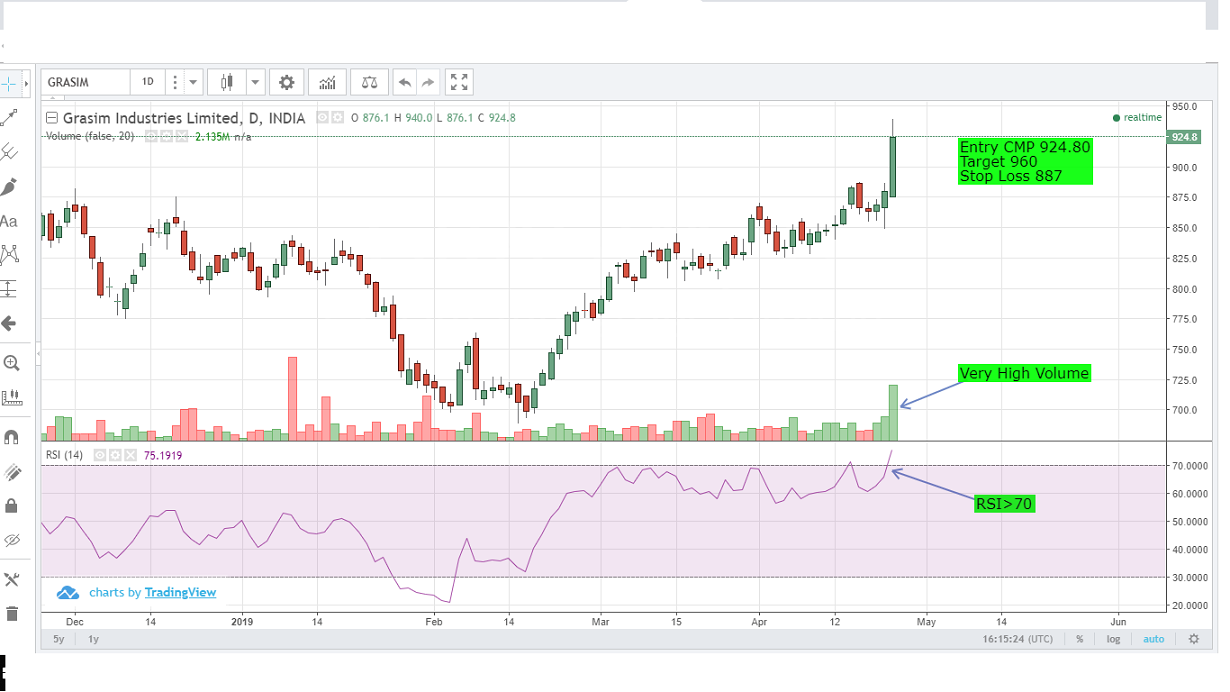
Bullish candlestick pattern formation can be seen in grasim along with breakout and high Volume. The RSI>70 which indicates...
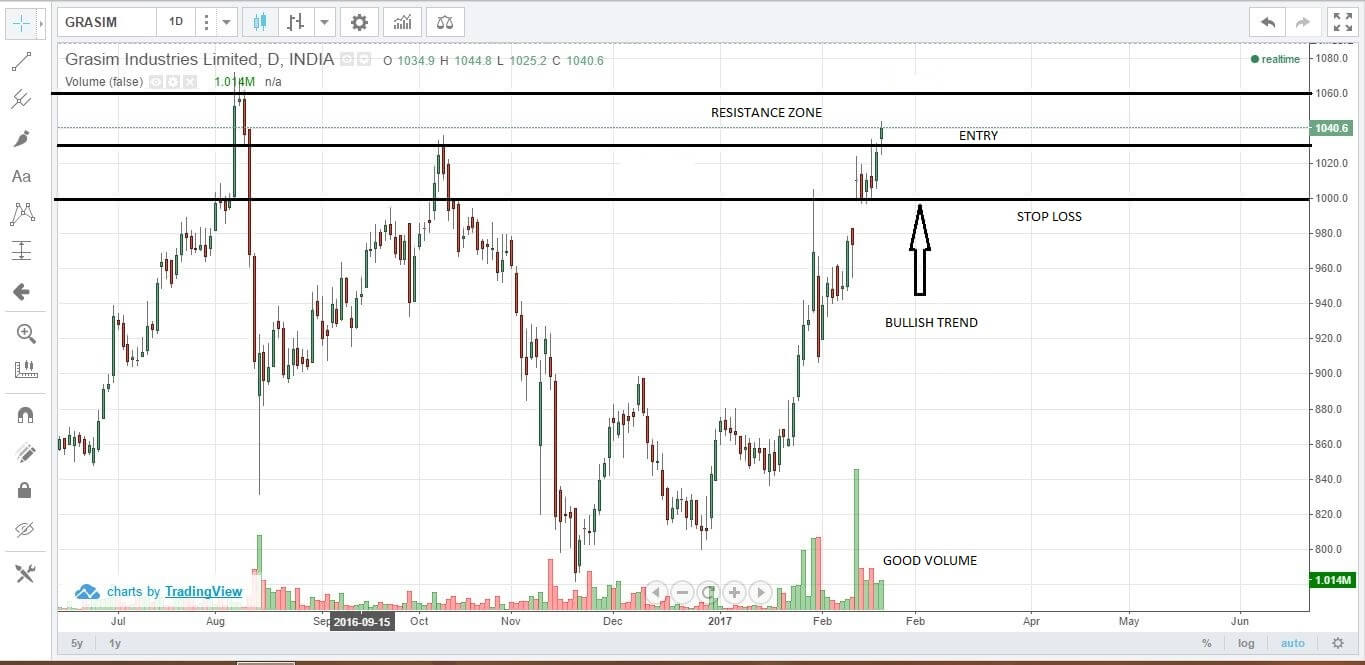
BULLISH TREND
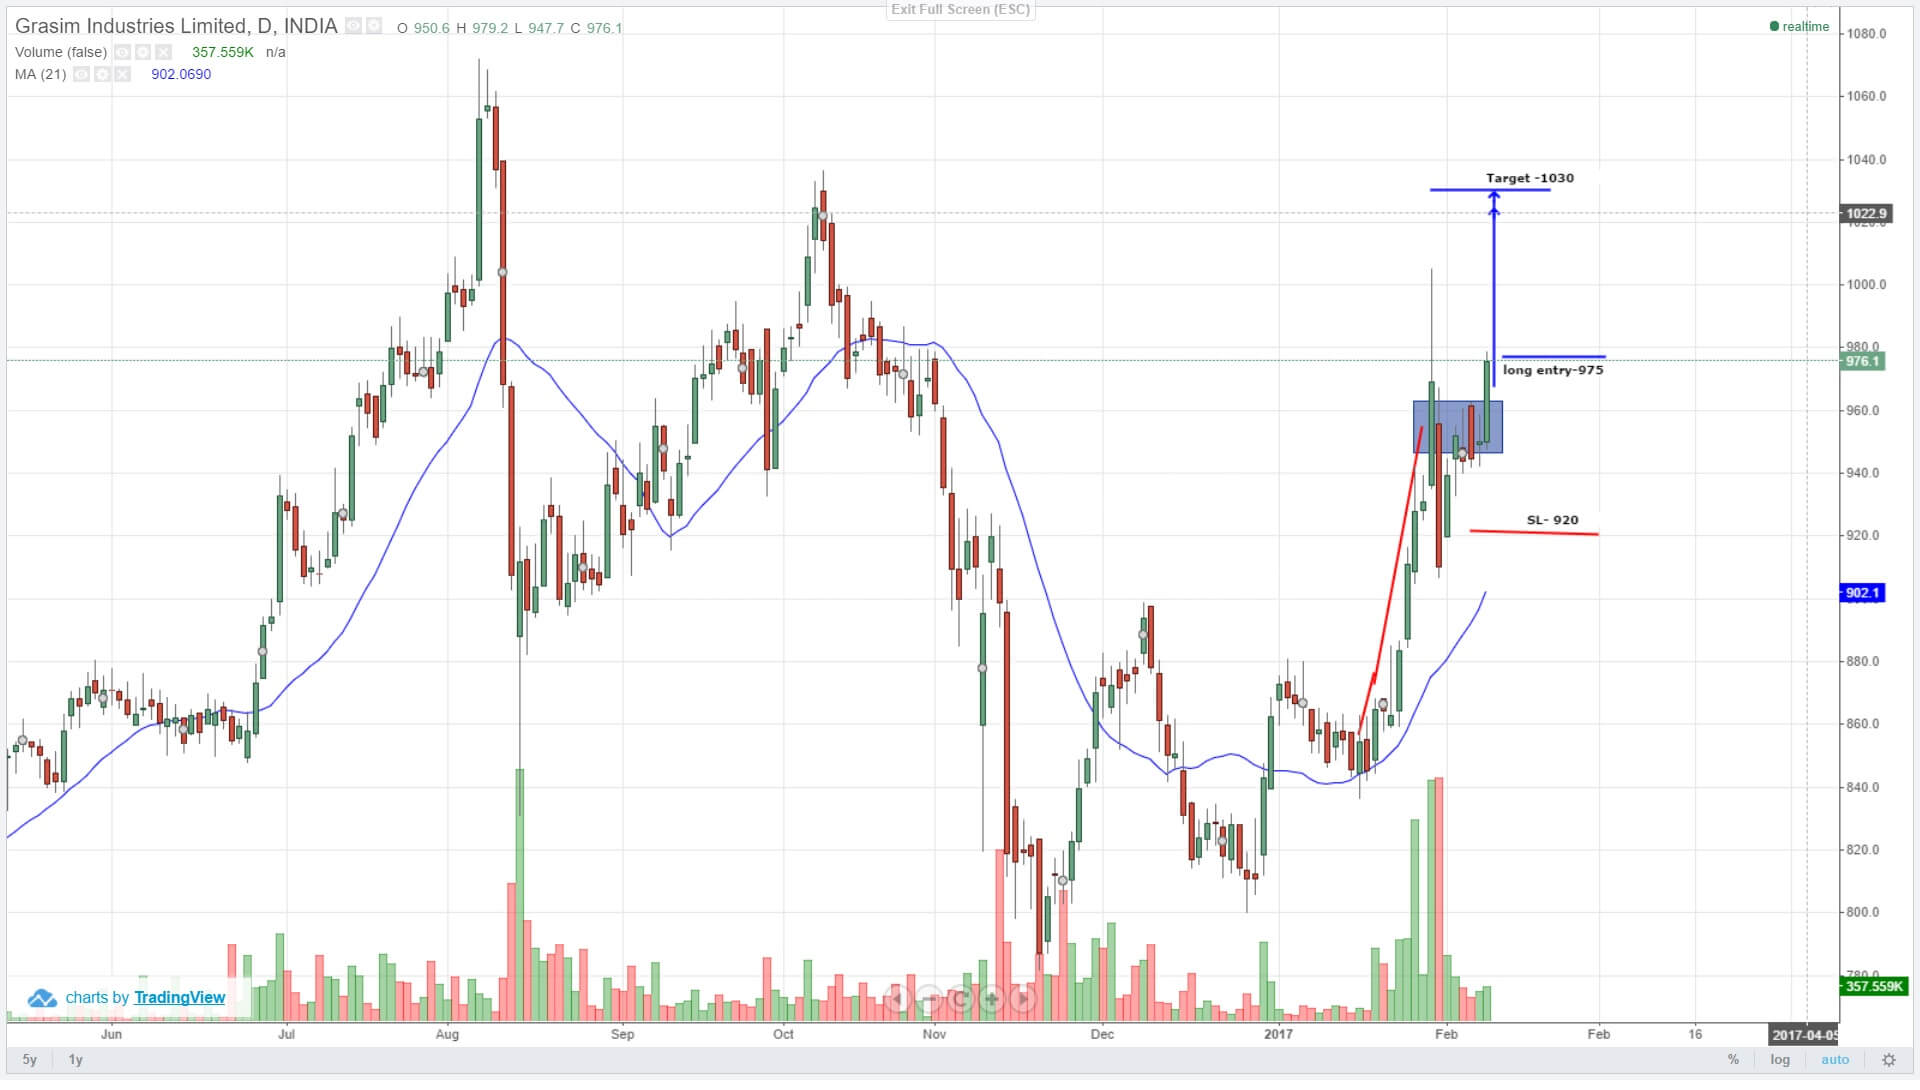
LOOKING TO CROSS PREVIOUS RESISTANCE ZONE – ENTRY 1030, TARGET 1 – 1060, TARGET2 – 1080 ...
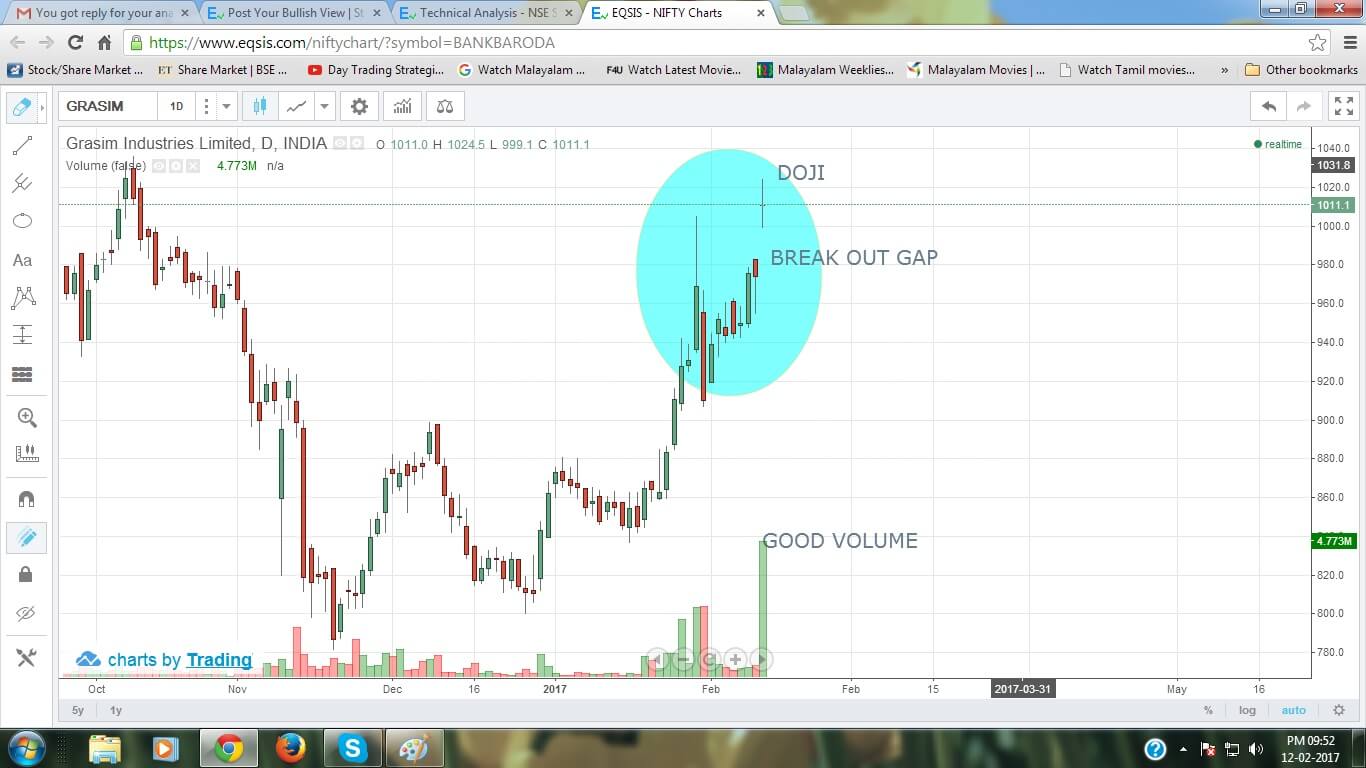
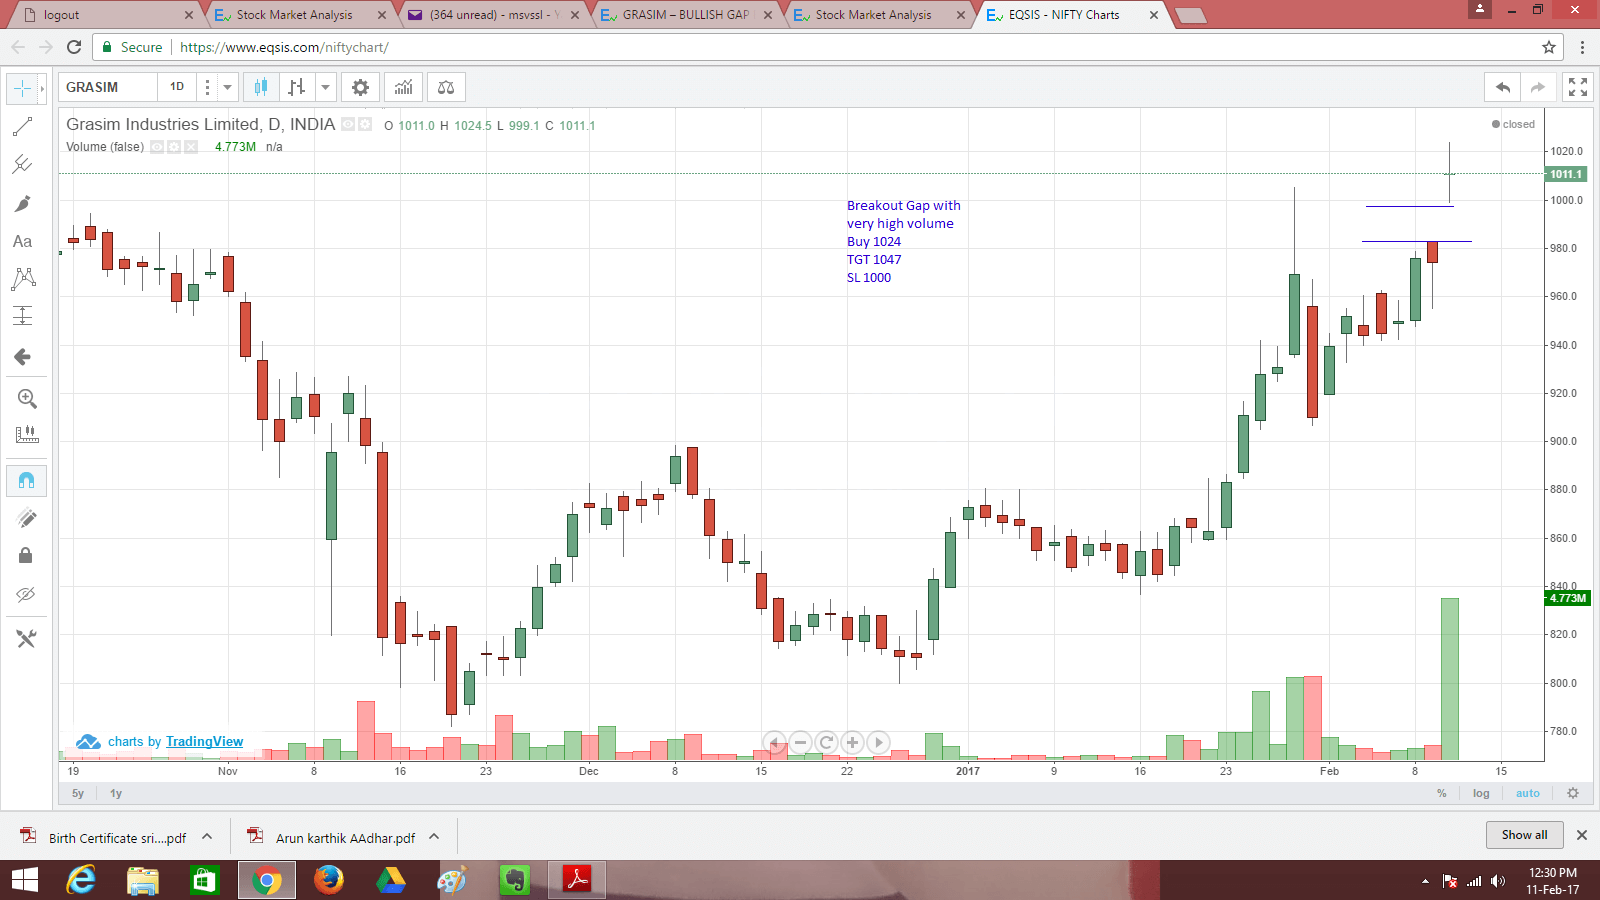
Grasim is having a breakout gap with very high voulme. May be begining of a bullish trend.
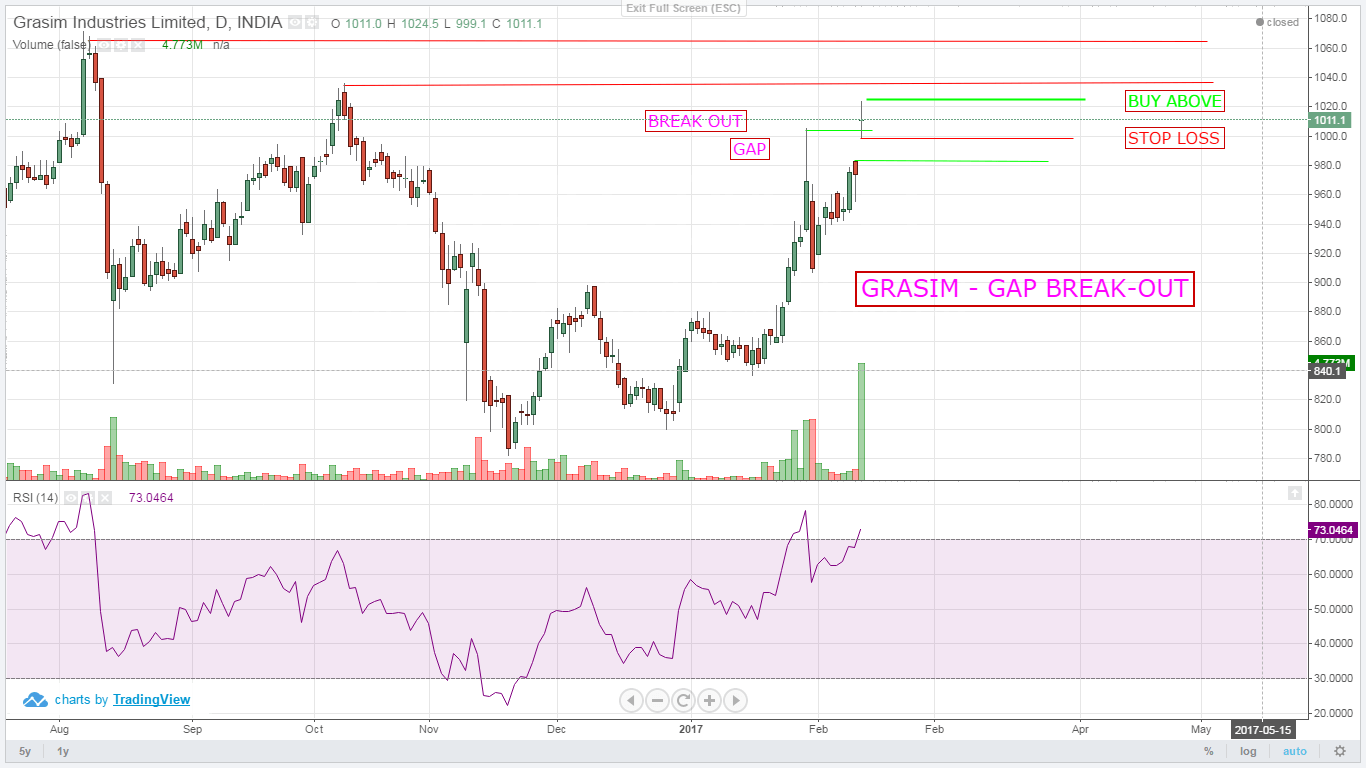
GRASIM BULLISH BREAK-OUT WITH GAP AND HIGH VOLUME, But near earliest resistant at 1036.7. then 2nd target – 1060.
BULLISH FLAG
Partial flag formation underway . Though Vol above average . Closed above last three days high reflecting buying pressure...
Recently Active Members
Bullish View


Bearish View
-
 Bearish-GAP-SHORT-BICON-25-10-2019 October 25, 2019
-
 FEDERAL BANK – BEARISH ENGULFING October 17, 2019
-
 Cummins India – Bearish Engulfing – 24Sep19 September 25, 2019
-
 Day29-Tata Motors DVR – Bearish Piercing – 12Sep19 September 12, 2019
-
 Day27-Bearish-Engulfing pattern-Tech Mahindtra-09Sep19 September 10, 2019