
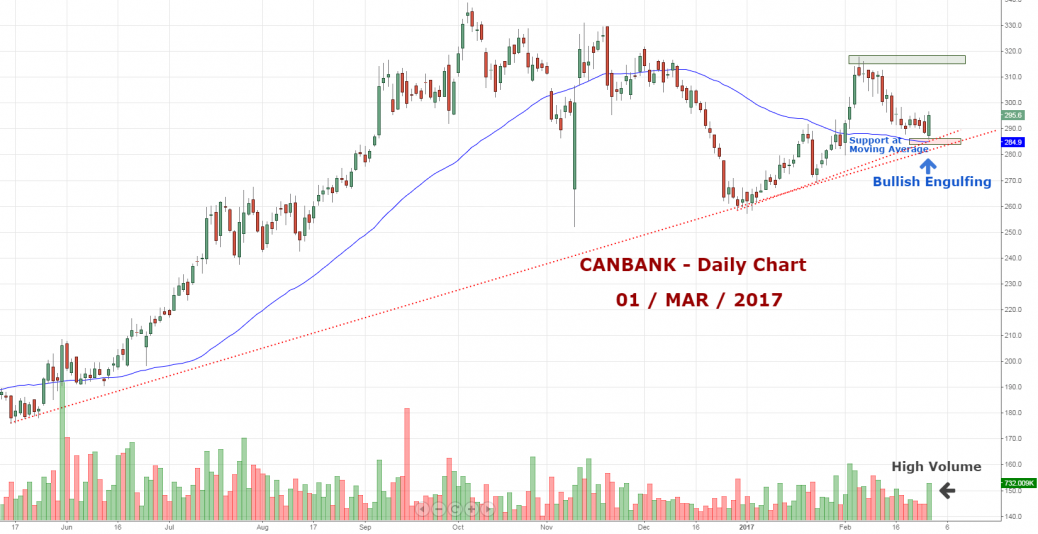
This stock found support at its upward sloping trend line. Meanwhile it sketched bullish engulfing pattern along with above average volume. The technical indicator signals bullish move.
The recent corrective trend found support at Fibonacci retracement level of 61.8%
Support Zone: 285
Resistance Zone: 315


Mr.Murugan,how do you fix the entry price above 300???
How do you arrive at 15 days duration to reach target?
I see the last few day consolidating with the high of Rs.300..
The duration is calculated by understanding the time taken for price to travel Rs.15 to 20
I see the last few day consolidating with the high of Rs.300..
The duration is calculated by understanding the time taken for price to travel Rs.15 to 20
Dear sir
Bullish/bearish engulfing is applicable only in DOWN/UP trend and not during consolidation. It seems the chart is captured before today s (01 03 2017 ) closing hours because of which today doji candle is not there.Even if we consider the doji as breakout the bull trend is not sustainable as there is huge selling pressure (long upper tail).Hence the power of the bull is doubtful since in any doji none has showed their strength
Sir here the Engulfing formation covered almost all the previous days (consolidation) candle. This candle formed at the lower range of the recent price action. Meanwhile the FIB 61.8% matches at the current levels. Hope you could see the moving average and trend line providing support.
Above all the volume is impressive. Hence i felt the chance for the price to move up is greater than 50%
Here the trade has been initiated, but the price were coming down. Trading at 290 levels. Option hovers around Rs.5
Stop loss triggered