
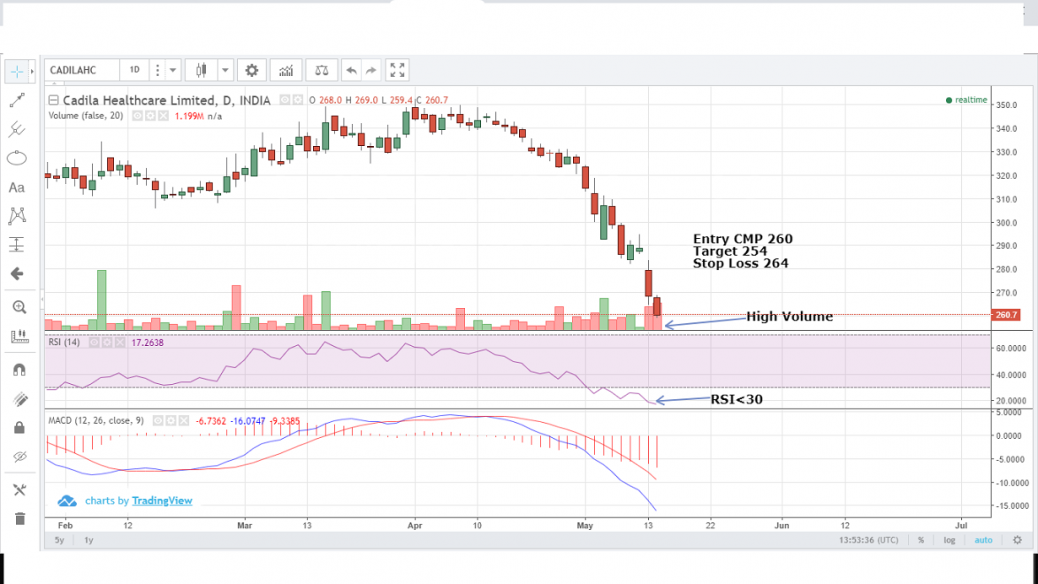
Breakdown with Bearish candle stick pattern formation can be seen with high volume in cadila healthcare. Also stock is in the downtrend. RSI is below 30 which indicates weakness in the stock.
feel free to call us +919500077790 info@eqsis.com
Breakdown with Bearish candle stick pattern formation can be seen with high volume in cadila healthcare. Also stock is in the downtrend. RSI is below 30 which indicates weakness in the stock.
| M | T | W | T | F | S | S |
|---|---|---|---|---|---|---|
| 1 | 2 | 3 | 4 | 5 | 6 | 7 |
| 8 | 9 | 10 | 11 | 12 | 13 | 14 |
| 15 | 16 | 17 | 18 | 19 | 20 | 21 |
| 22 | 23 | 24 | 25 | 26 | 27 | 28 |
| 29 | 30 | |||||
 Bearish-GAP-SHORT-BICON-25-10-2019 October 25, 2019
 FEDERAL BANK – BEARISH ENGULFING October 17, 2019
 Cummins India – Bearish Engulfing – 24Sep19 September 25, 2019
 Day29-Tata Motors DVR – Bearish Piercing – 12Sep19 September 12, 2019
 Day27-Bearish-Engulfing pattern-Tech Mahindtra-09Sep19 September 10, 2019
Stock Trading is business, the success depends not just on capital or subscribing advisory services or participating workshops. The factors such as your awareness level about business, Efforts and your contributions, Smartness, Knowledge in analysis and trading instrument, availability of infrastructure and emotional control determine your success.
EQSIS, A Stock Market Research Firm
Knowledge is Power. Here you may start from basics, get support while practicing and evolve as active analyst, later you can become a pro


Good! Your target achieved.
Can u explain what kind of pattern is this.
Here the stock has broken the support level.
Hi,
Could you please explain where is the support levels in charts.
Thanks
how was the stop loss calculated?