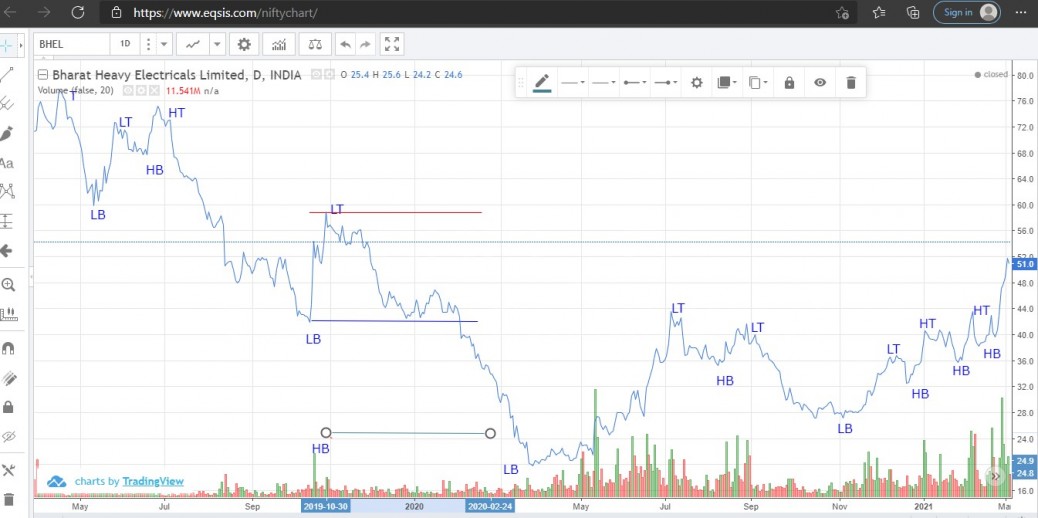
Two years line chart has been considered for seeing the trend of BHEL share. I have noticed the script is in down trend. However, to analyze the trend by using Dow theory, I have plotted major tops and bottom. On 30 October 2019, Rs 58.8 is the low top and on 31 January 2020 I have noted the share price was dropping down below Rs 42.1 the stock has broken the previous low. At this price, I have short the share, having stop loss of Rs. 58.8 and Target of Rs 24.9 (to have reward little higher than difference between stop loss and entry price being the risk)
BHEL – DOW THEORY – DOWNTREND
feel free to call us +919500077790 info@eqsis.com
Stock Analysis
M | T | W | T | F | S | S |
---|---|---|---|---|---|---|
1 | 2 | 3 | 4 | 5 | ||
6 | 7 | 8 | 9 | 10 | 11 | 12 |
13 | 14 | 15 | 16 | 17 | 18 | 19 |
20 | 21 | 22 | 23 | 24 | 25 | 26 |
27 | 28 | 29 | 30 | 31 |
Bullish View
Bearish View
- Bearish-GAP-SHORT-BICON-25-10-2019 October 25, 2019
- FEDERAL BANK – BEARISH ENGULFING October 17, 2019
- Cummins India – Bearish Engulfing – 24Sep19 September 25, 2019
- Day29-Tata Motors DVR – Bearish Piercing – 12Sep19 September 12, 2019
- Day27-Bearish-Engulfing pattern-Tech Mahindtra-09Sep19 September 10, 2019
How this forum help stock traders?
Stock Trading is business, the success depends not just on capital or subscribing advisory services or participating workshops. The factors such as your awareness level about business, Efforts and your contributions, Smartness, Knowledge in analysis and trading instrument, availability of infrastructure and emotional control determine your success.
Hi,
Your observation is good sir …. Thanks for posting your views.