
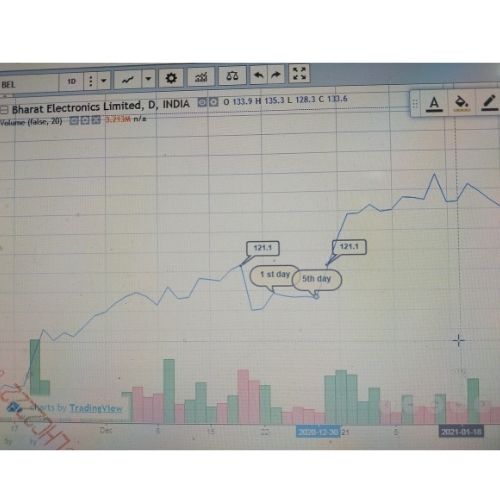
WE CAN SEE A SIDE WAY MOVEMENT FROM 1 ST DAY TO 5 TH DAY AND AFTER BREAKING PREVIOUS HIGH 121.1 THE STOCK MOVES UP FROM 6 TH DAY WE CAN ALSO SEE A INCREASE IN VOLUME HERE
feel free to call us +919500077790 info@eqsis.com
WE CAN SEE A SIDE WAY MOVEMENT FROM 1 ST DAY TO 5 TH DAY AND AFTER BREAKING PREVIOUS HIGH 121.1 THE STOCK MOVES UP FROM 6 TH DAY WE CAN ALSO SEE A INCREASE IN VOLUME HERE
| M | T | W | T | F | S | S |
|---|---|---|---|---|---|---|
| 1 | 2 | |||||
| 3 | 4 | 5 | 6 | 7 | 8 | 9 |
| 10 | 11 | 12 | 13 | 14 | 15 | 16 |
| 17 | 18 | 19 | 20 | 21 | 22 | 23 |
| 24 | 25 | 26 | 27 | 28 | 29 | 30 |
 Bearish-GAP-SHORT-BICON-25-10-2019 October 25, 2019
 FEDERAL BANK – BEARISH ENGULFING October 17, 2019
 Cummins India – Bearish Engulfing – 24Sep19 September 25, 2019
 Day29-Tata Motors DVR – Bearish Piercing – 12Sep19 September 12, 2019
 Day27-Bearish-Engulfing pattern-Tech Mahindtra-09Sep19 September 10, 2019
Stock Trading is business, the success depends not just on capital or subscribing advisory services or participating workshops. The factors such as your awareness level about business, Efforts and your contributions, Smartness, Knowledge in analysis and trading instrument, availability of infrastructure and emotional control determine your success.
EQSIS, A Stock Market Research Firm
Knowledge is Power. Here you may start from basics, get support while practicing and evolve as active analyst, later you can become a pro


Hi,
Conditions were not met…….. Try to find more accurate bullish flag patterns. Refer to the attached screenshot or else Please refer to the training handout book.