
we can see a red candle stick before green candle stick which is bigger shows the stock movement down
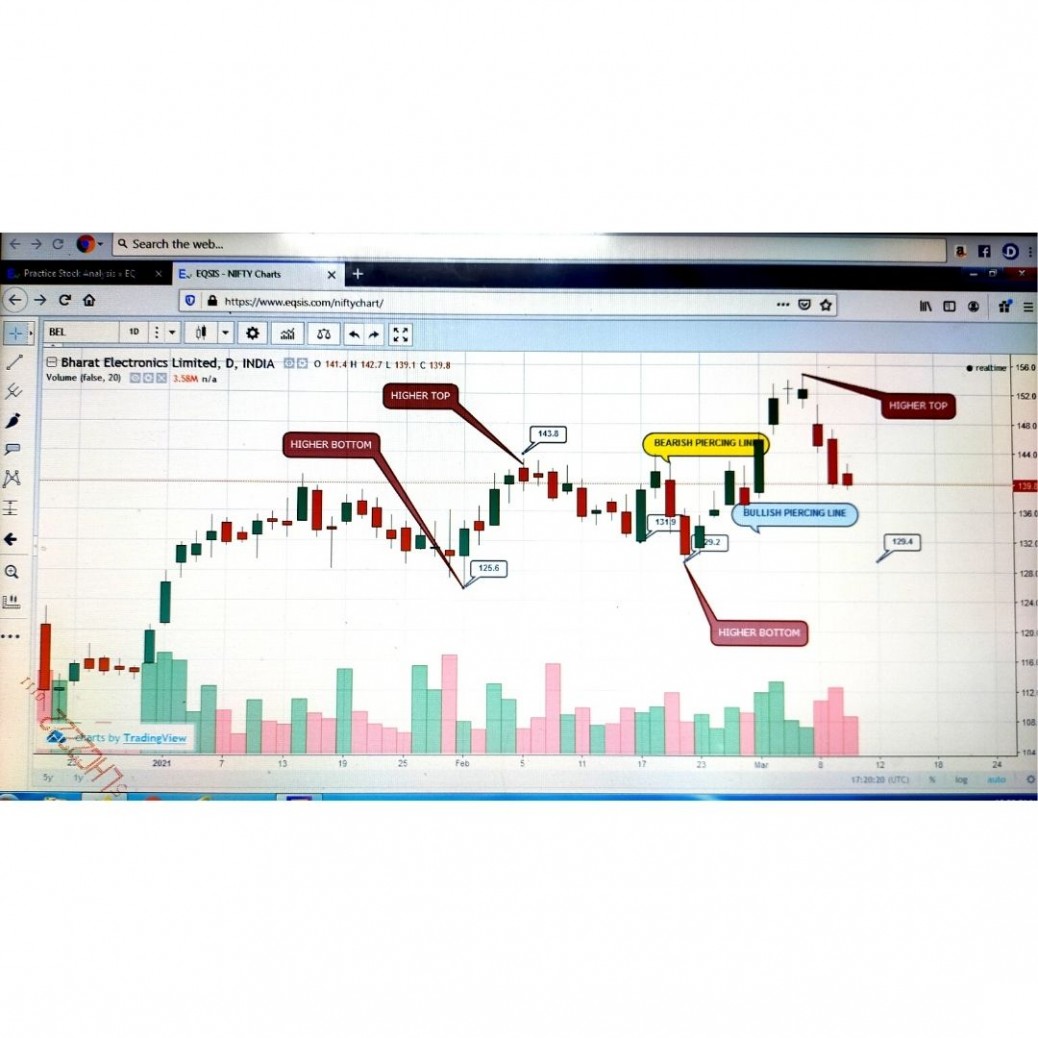
now by this graph we see a higher top and higher bottom patter
now we have to wait for two to three days if the stock does not cut the previous low ie 129.4 and if it makes another higher top then we can take a long position keeping a stop loss of 129.40


