
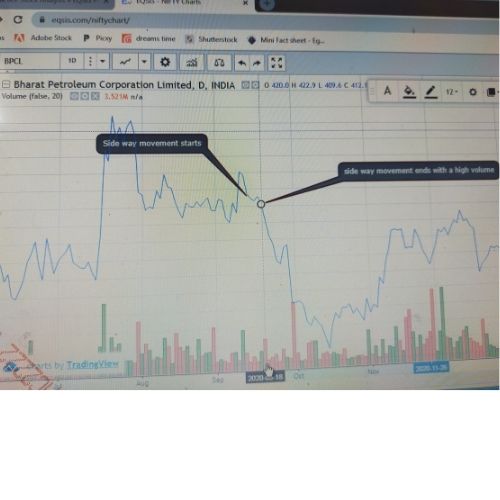
we can see a side way movement of the above stock after the end of its upward movement
and around 7 days we can see a increase in volume of the stock and also an sudden bearish move of the above stock
feel free to call us +919500077790 info@eqsis.com
we can see a side way movement of the above stock after the end of its upward movement
and around 7 days we can see a increase in volume of the stock and also an sudden bearish move of the above stock
| M | T | W | T | F | S | S |
|---|---|---|---|---|---|---|
| 1 | 2 | 3 | 4 | 5 | 6 | 7 |
| 8 | 9 | 10 | 11 | 12 | 13 | 14 |
| 15 | 16 | 17 | 18 | 19 | 20 | 21 |
| 22 | 23 | 24 | 25 | 26 | 27 | 28 |
| 29 | 30 | |||||
 Bearish-GAP-SHORT-BICON-25-10-2019 October 25, 2019
 FEDERAL BANK – BEARISH ENGULFING October 17, 2019
 Cummins India – Bearish Engulfing – 24Sep19 September 25, 2019
 Day29-Tata Motors DVR – Bearish Piercing – 12Sep19 September 12, 2019
 Day27-Bearish-Engulfing pattern-Tech Mahindtra-09Sep19 September 10, 2019
Stock Trading is business, the success depends not just on capital or subscribing advisory services or participating workshops. The factors such as your awareness level about business, Efforts and your contributions, Smartness, Knowledge in analysis and trading instrument, availability of infrastructure and emotional control determine your success.
EQSIS, A Stock Market Research Firm
Knowledge is Power. Here you may start from basics, get support while practicing and evolve as active analyst, later you can become a pro


Hi,
Identifying the flag pattern is an easy job if you have the right trading conditions.
Now is the time to go through the flag chart pattern strategy step-by-step conditions for the bearish flag pattern or Inverted flag pattern
A bearish flag pattern forms when the price falls sharply, then moves sideways. This sideways movement can be considered as a flag and volume should be low during the sideway movement meanwhile volume should be high during the breakout day.
Don’t consider single day steeper pole
The duration of the sideways movement of the flag cloth is 4-7 days.
Trade Plan for bearish flag pattern-
Your entry should be just below the breakouts of the consolidation
Set a stop loss just above the flag formation
Your target should be based on the height of the flag
Refer to the below screenshot
Sample pic