
Company chosen : Dabur India Ltd., an Health Care Company.
Type of Chart : Candlestick type
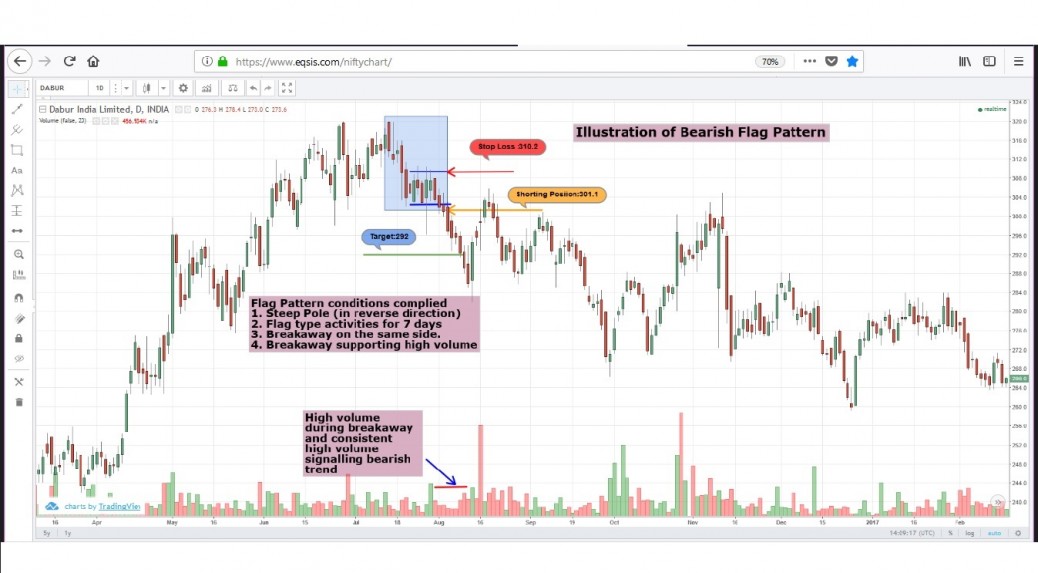
Bearish Flag pattern also depicts Demand and Supply behaviour. But the behaviour is towards opposite direction due to aggressive selling and weakening demand. It also provides similar opportunity to trade and make profit as that of Bullish Flag. Traders need to initiate “Short” instead of “Long”.
Enclosed Bearish Flag pattern can be co-related with its established behaviour. Location of Flag Pattern is highlighted with shade in the chart.
1. * Steep Pole in the downward direction can be seen which is prerequisite to form a Bearish Flag. It shows very high Bearish movement supported with high volume.
2. * Subsequently Flag type activity may be seen indicating resistance from Demand and the activity vibrates with in a range over a period of time.
3. * Breakaway on the same side indicating surge on the same side (downward).
4. * Breakaway with support of high volume. It shows the strong Selling supported with high volume with more intensity.


