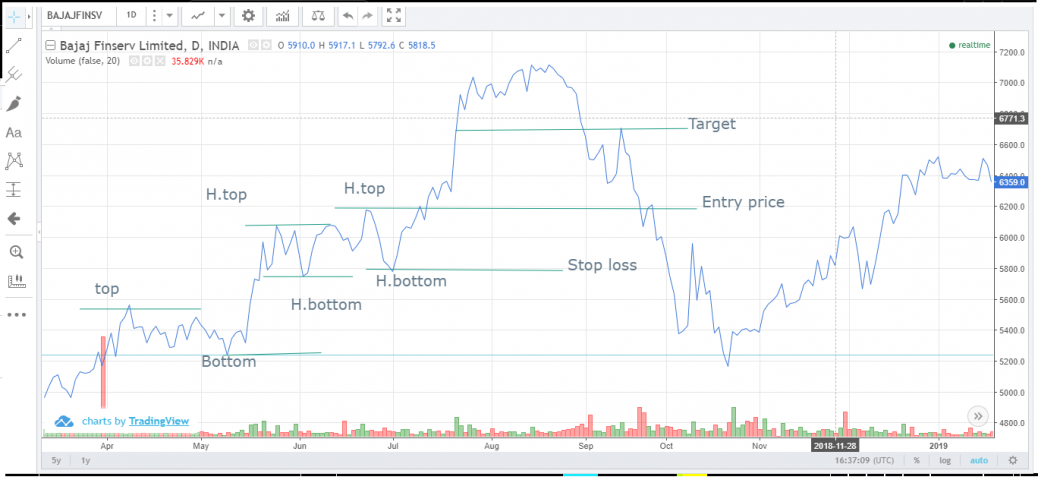
The chart a higher top is witnessed at 22/6/18, and a successive Higher bottom seen at 2/7/18 with above average volume, qualifying as a Buy zone or a bullish trend, since a demand>supply has been identified therefore a long position can be assumed . So an entry point considered at 6193, and place the stop loss at 5793In .5, and set the target at 6697.7, allowing a profit margin of 100 with respect to stop loss. With the target achieved at 20/07/18.
Bajaj Finserv-Bullish-Dow Theory.
feel free to call us +919500077790 info@eqsis.com
Stock Analysis
M | T | W | T | F | S | S |
---|---|---|---|---|---|---|
1 | 2 | 3 | 4 | 5 | 6 | 7 |
8 | 9 | 10 | 11 | 12 | 13 | 14 |
15 | 16 | 17 | 18 | 19 | 20 | 21 |
22 | 23 | 24 | 25 | 26 | 27 | 28 |
29 | 30 |
Bullish View
Bearish View
- Bearish-GAP-SHORT-BICON-25-10-2019 October 25, 2019
- FEDERAL BANK – BEARISH ENGULFING October 17, 2019
- Cummins India – Bearish Engulfing – 24Sep19 September 25, 2019
- Day29-Tata Motors DVR – Bearish Piercing – 12Sep19 September 12, 2019
- Day27-Bearish-Engulfing pattern-Tech Mahindtra-09Sep19 September 10, 2019
How this forum help stock traders?
Stock Trading is business, the success depends not just on capital or subscribing advisory services or participating workshops. The factors such as your awareness level about business, Efforts and your contributions, Smartness, Knowledge in analysis and trading instrument, availability of infrastructure and emotional control determine your success.
Hi sir,
Thanks for posting your analysis… It’s always good to mark all major tops and bottoms with two years of data.