
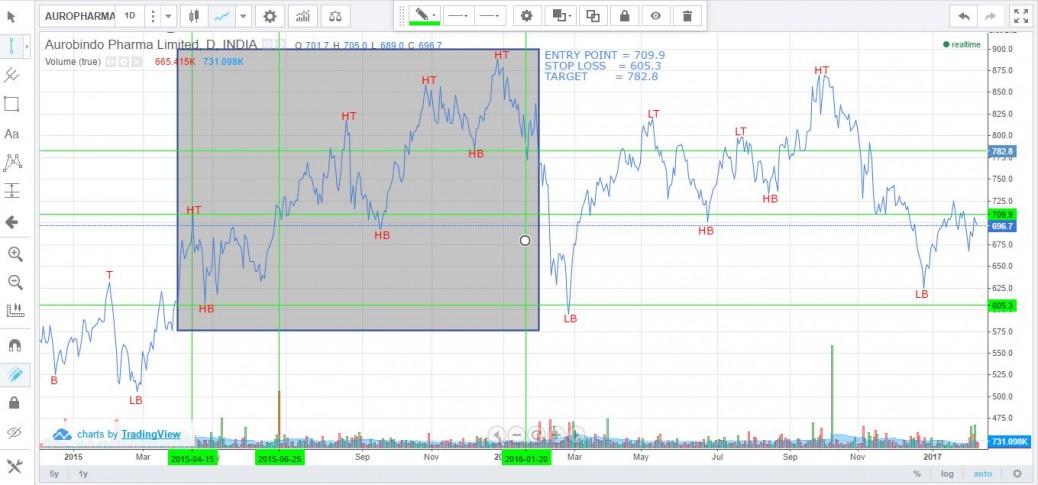
The chart shows a bullish trend in the beginning from March 2015 to Jan 2016. The Stop Loss is set at 605.3, the first HB in the chart. Our trade strategy here is to keep an eye on the price when it falls below the next formed HB, which occurs on 20th Jan for the first time at a price value of 782.8 (our Target).


Good work. I also appreciate your detail discription..