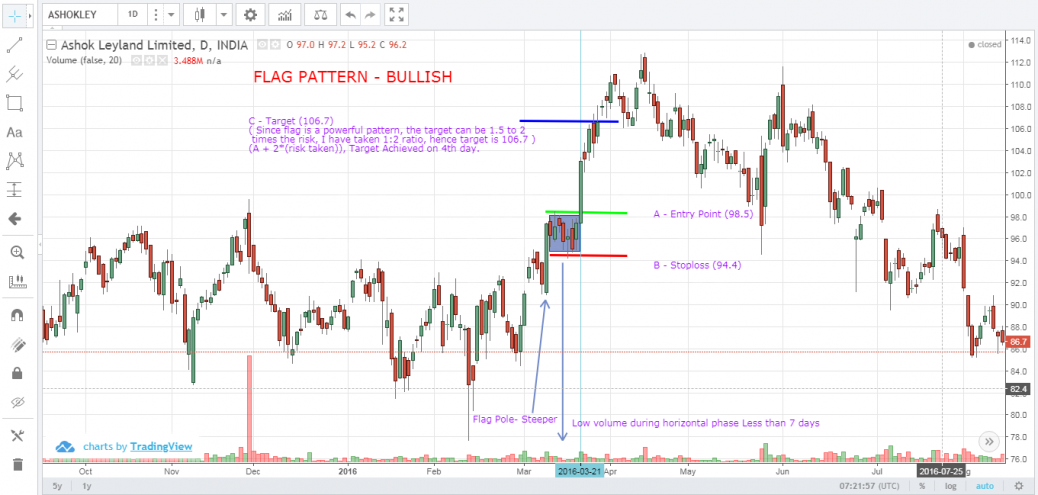
Witness sudden surge in Movement with a steeper pole and a horizontal consolidation . The rectangular price movement was for 6 days and then the breakout happened on the 7th day, Entry Point is Marked A(98.5). The stoploss is set as point B(94.4). Since Flags are a powerful pattern the target can be 1.5 or 2 times the risk taken, Since the pole was steeper surge on a single day, I took a call for 1:2 risk / reward ratio. The target C (106.7) was reached on the 5th day
ASHOKLEY – FLAG PATTERN – BULLISH
feel free to call us +919500077790 info@eqsis.com
Stock Analysis
M | T | W | T | F | S | S |
---|---|---|---|---|---|---|
1 | 2 | 3 | 4 | 5 | ||
6 | 7 | 8 | 9 | 10 | 11 | 12 |
13 | 14 | 15 | 16 | 17 | 18 | 19 |
20 | 21 | 22 | 23 | 24 | 25 | 26 |
27 | 28 | 29 | 30 | 31 |
Bullish View
Bearish View
- Bearish-GAP-SHORT-BICON-25-10-2019 October 25, 2019
- FEDERAL BANK – BEARISH ENGULFING October 17, 2019
- Cummins India – Bearish Engulfing – 24Sep19 September 25, 2019
- Day29-Tata Motors DVR – Bearish Piercing – 12Sep19 September 12, 2019
- Day27-Bearish-Engulfing pattern-Tech Mahindtra-09Sep19 September 10, 2019
How this forum help stock traders?
Stock Trading is business, the success depends not just on capital or subscribing advisory services or participating workshops. The factors such as your awareness level about business, Efforts and your contributions, Smartness, Knowledge in analysis and trading instrument, availability of infrastructure and emotional control determine your success.
Hi Allen, good find. But as per Eqsis advice we should not consider the single day rise as steeper pole. I too did same mistake in my first post on Flag Pattern.
Hi Mohan,
I too was a bit doubtful, but went ahead. Will take this into account in future. I appreciate your time.