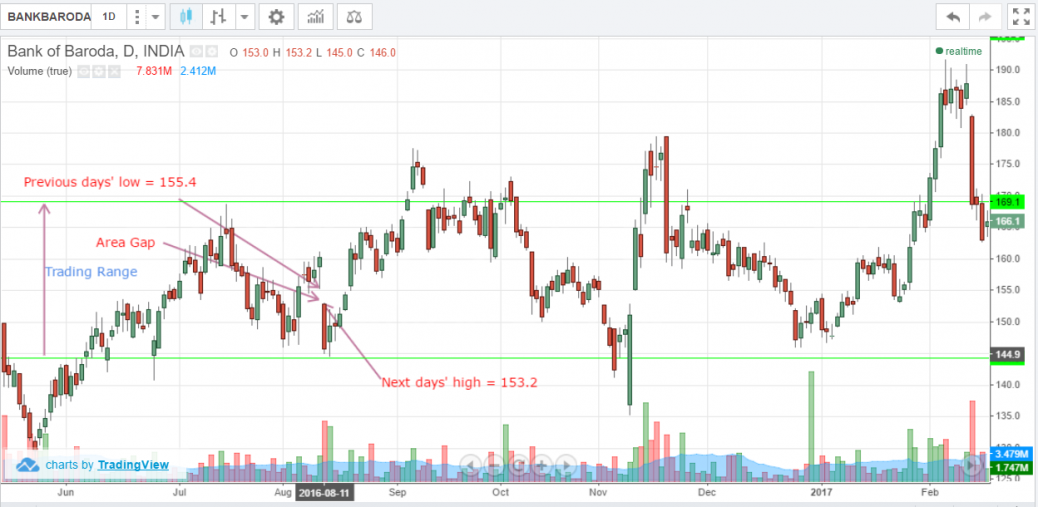
I’ve assumed here that a trading zone exist between the price values of 169.1 and 144.3. In between this trading range, we see a gap in the low of previous day(10th Aug) and high of the next day(11th of Aug) of 2.2 points. Though, the trade volume is very high on the next day, i.e. 11th of Aug, we won’t make any trade plans here, as we’ve to assume it to be only a ‘suspect’ which can breakout in future. And we see in the chart that, later in course of time this gap is filled as well. Please comment if my assumptions are wrong or if we can make a trade here.
Area Gap – Bank of Baroda
feel free to call us +919500077790 info@eqsis.com
0 Comments
Stock Analysis
M | T | W | T | F | S | S |
---|---|---|---|---|---|---|
1 | 2 | 3 | 4 | 5 | 6 | 7 |
8 | 9 | 10 | 11 | 12 | 13 | 14 |
15 | 16 | 17 | 18 | 19 | 20 | 21 |
22 | 23 | 24 | 25 | 26 | 27 | 28 |
29 | 30 |
Bullish View
Bearish View
- Bearish-GAP-SHORT-BICON-25-10-2019 October 25, 2019
- FEDERAL BANK – BEARISH ENGULFING October 17, 2019
- Cummins India – Bearish Engulfing – 24Sep19 September 25, 2019
- Day29-Tata Motors DVR – Bearish Piercing – 12Sep19 September 12, 2019
- Day27-Bearish-Engulfing pattern-Tech Mahindtra-09Sep19 September 10, 2019
How this forum help stock traders?
Stock Trading is business, the success depends not just on capital or subscribing advisory services or participating workshops. The factors such as your awareness level about business, Efforts and your contributions, Smartness, Knowledge in analysis and trading instrument, availability of infrastructure and emotional control determine your success.