
DOW bullish chart pattern can be seen. High volume observed during previous top level. High delivery percentage also indicates bullish move. Target can be set at 1.5 to 2 times the risk keeping the stop loss intact
feel free to call us +919500077790 info@eqsis.com
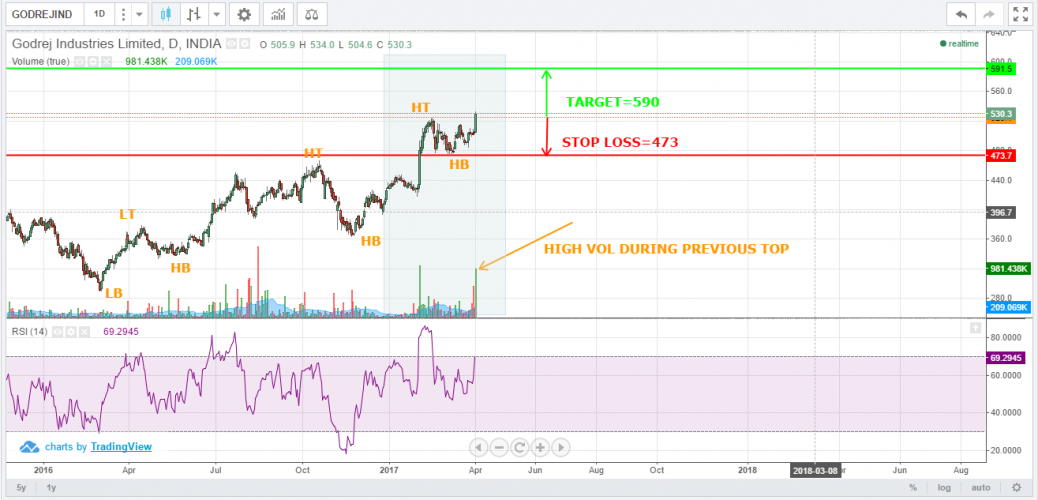
DOW bullish chart pattern can be seen. High volume observed during previous top level. High delivery percentage also indicates bullish move. Target can be set at 1.5 to 2 times the risk keeping the stop loss intact
| M | T | W | T | F | S | S |
|---|---|---|---|---|---|---|
| 1 | 2 | 3 | 4 | 5 | ||
| 6 | 7 | 8 | 9 | 10 | 11 | 12 |
| 13 | 14 | 15 | 16 | 17 | 18 | 19 |
| 20 | 21 | 22 | 23 | 24 | 25 | 26 |
| 27 | 28 | 29 | 30 | 31 | ||
 Bearish-GAP-SHORT-BICON-25-10-2019 October 25, 2019
 FEDERAL BANK – BEARISH ENGULFING October 17, 2019
 Cummins India – Bearish Engulfing – 24Sep19 September 25, 2019
 Day29-Tata Motors DVR – Bearish Piercing – 12Sep19 September 12, 2019
 Day27-Bearish-Engulfing pattern-Tech Mahindtra-09Sep19 September 10, 2019
Stock Trading is business, the success depends not just on capital or subscribing advisory services or participating workshops. The factors such as your awareness level about business, Efforts and your contributions, Smartness, Knowledge in analysis and trading instrument, availability of infrastructure and emotional control determine your success.
EQSIS, A Stock Market Research Firm
Knowledge is Power. Here you may start from basics, get support while practicing and evolve as active analyst, later you can become a pro


Dear sir/madam
Well to find the breakout.The said breakout is valid from the stand point of
1 Sym triangle (orange lines)
2 Range (blue lines)
3. Dow with in the above period it self
Since the level is at all time high my humble opinion is to have minimum risk and hence the microscopic DOW theory may be considered for which the stop loss is only Rs 514 compared to the other type of patterns where the SL level is still low . The long trade plan is adaptable as supported by two indicators and hence may be successful
Good spot