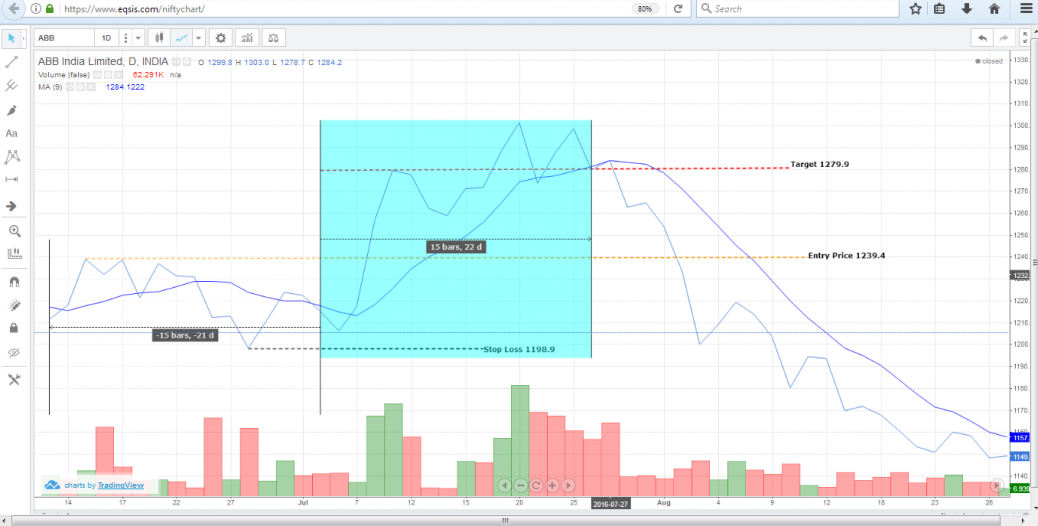
A moving average technical indicator is applied for the days for 21 which considers a month trend of a particular stock.
The indicator is applied for trending zone of where bulls leads in the market.
As long as the price stays above the average line the prices were seen moving up.
The prices attracted and repelled by the equilibrium at the prices mentioned below shows that the trend is expected to get reversal.
1276 and 1281
The previous 21 days of the trend is considered to mark the SL, EP and the Target.
Long position can be placed at the price above 1239.4
The risk taken is considered 40.5 whose target is attained in two days that is 1279.9
Volume is negligible in Moving average technical indicator.


