
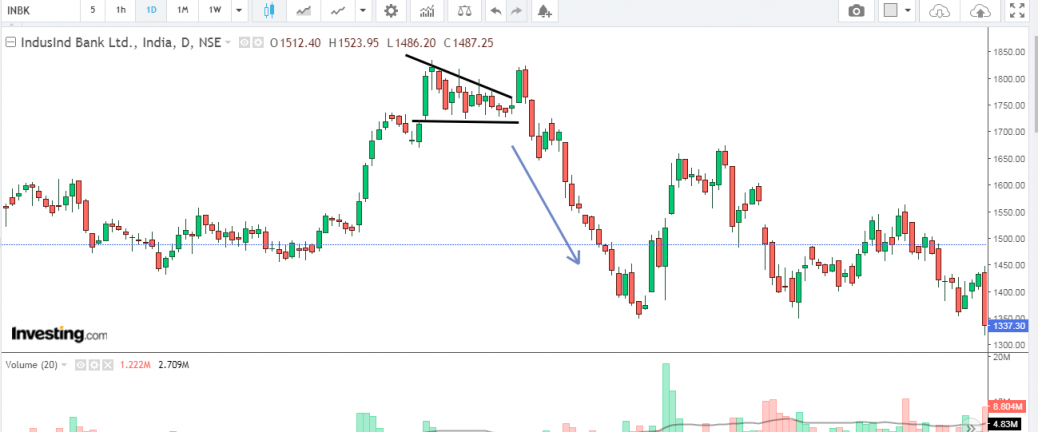
A triangle is a chart pattern, depicted by drawing trendlines along a converging price range, that connotes a pause in the prevailing trend.Triangles are similar to wedges and pennants and can be either a continuation pattern, if validated, or a powerful reversal pattern, in the event of failure.There are three potential triangle variations that can develop as price action carves out a holding pattern, namely ascending, descending, and symmetrical triangles. Bearish Triangle is an inverted version of the bullish triangle and considered a breakdown pattern. The lower trendline should be horizontal, connecting near identical lows. The upper trendline declines diagonally toward the apex. The breakdown occurs when the price collapses through the lower horizontal trendline support as a downtrend resumes. The lower trendline, which was support, now becomes resistance. In case of indusind bank the lower line is horizontal, upper line gradually declines, and that is followed by a downward breakout


Hi,
The triangle area should be a minimum 1.5 months.