
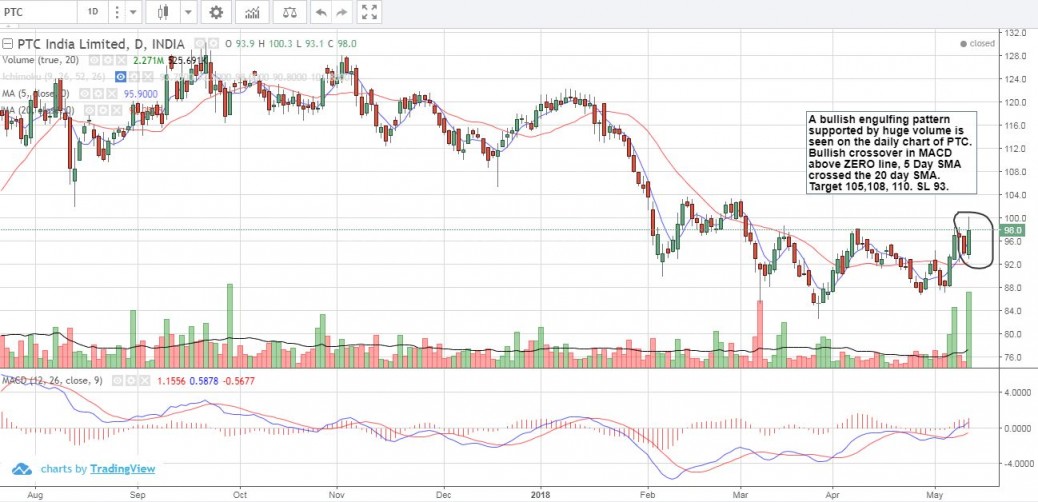
A bullish engulfing pattern supported by huge volume is seen on the daily chart of PTC. Bullish crossover in MACD above ZERO line, 5 Day SMA crossed the 20 day SMA. Target 105,108, 110. SL 93.
feel free to call us +919500077790 info@eqsis.com
A bullish engulfing pattern supported by huge volume is seen on the daily chart of PTC. Bullish crossover in MACD above ZERO line, 5 Day SMA crossed the 20 day SMA. Target 105,108, 110. SL 93.
| M | T | W | T | F | S | S |
|---|---|---|---|---|---|---|
| 1 | 2 | 3 | 4 | 5 | ||
| 6 | 7 | 8 | 9 | 10 | 11 | 12 |
| 13 | 14 | 15 | 16 | 17 | 18 | 19 |
| 20 | 21 | 22 | 23 | 24 | 25 | 26 |
| 27 | 28 | 29 | 30 | 31 | ||
 Bearish-GAP-SHORT-BICON-25-10-2019 October 25, 2019
 FEDERAL BANK – BEARISH ENGULFING October 17, 2019
 Cummins India – Bearish Engulfing – 24Sep19 September 25, 2019
 Day29-Tata Motors DVR – Bearish Piercing – 12Sep19 September 12, 2019
 Day27-Bearish-Engulfing pattern-Tech Mahindtra-09Sep19 September 10, 2019
Stock Trading is business, the success depends not just on capital or subscribing advisory services or participating workshops. The factors such as your awareness level about business, Efforts and your contributions, Smartness, Knowledge in analysis and trading instrument, availability of infrastructure and emotional control determine your success.
EQSIS, A Stock Market Research Firm
Knowledge is Power. Here you may start from basics, get support while practicing and evolve as active analyst, later you can become a pro


To
Malay Dasgupta,
Sir,
Your observations are correct.There is bullish engulfing with volume rise, but if you see the close of the bullish engulfing candle is not above the resistance line. PTC did went up above the resistance line on intraday basis, but it failed to close above the resistance of Rs. 98.30[ high of bearish candle of 09/04/2018].
As of today the stop loss of Rs. 93 is hit as stock has made a low of Rs. 91.10.
If you notice the stock is forming a ascending triangle pattern on the chart and should break up in your direction in near future. Just keep the watch and let it break the upper border of the triangle with close above it with volume confirmation.
Thanks and regards,
Dr. Bhushan