
@malay
-
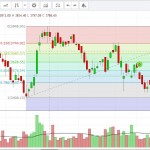
MALAY DASGUPTA wrote a new post, Bullish Engulfing with jump in volume 5 years, 11 months ago
A bullish engulfing pattern supported by huge volume is seen on the daily chart of PTC. Bullish crossover in MACD above ZERO line, 5 Day SMA crossed the 20 day SMA. Target 105,108, 110. SL 93.
-
MALAY DASGUPTA and
 Tamil Selvam J are now friends 6 years ago
 -

Peterjs and
MALAY DASGUPTA are now friends 6 years ago
-

MURUGAVEL and
-

EQSIS and
-
MALAY DASGUPTA wrote a new post, Indiabulls – Bullish Candle with a great volume 6 years ago
if close above 1306 ob closing basis, then immediate target would be 1328 and 1360 with a SL of 1275
-
MALAY DASGUPTA wrote a new post, Price reaching alltime high 6 years ago
Price is touching its upper band of Bollinger band, RSI is overbought, expect a correction and cab be bought at dips
-
MALAY DASGUPTA wrote a new post, Bullish GAP UP – TATACHEM 6 years ago
Gap open and not filled in throughout the day. Closed above its 100 EMA with good volume. if close above 720 on closing basis, a fresh long can be initiated with a target of 740, SL 695, support is at 680.
-
MALAY DASGUPTA wrote a new post, COLPAL witnessing a Double bottom formation on the daily chart 6 years ago
COLPAL has made a bullish candle with a tong surge in volume,though RSI is in overbought zone but the stock can be keep in watch list for swing trade. on Fib, the next resistance is at 1059 level, if the level is
-
MALAY DASGUPTA wrote a new post, Bullish Engulfing Pattern 6 years ago
-
MALAY DASGUPTA and
Latha Prabha Kumar are now friends 6 years ago
-
MALAY DASGUPTA and
 vignesh are now friends 6 years, 1 month ago
 -
MALAY DASGUPTA wrote a new post, Basics of Stock Trading 6 years, 1 month ago
After knowing about the basis of trading then one should know about how to place orders and types of orders that are available in the trading platform, this is essential because if we get confused about buy, sell,
-
MALAY DASGUPTA wrote a new post, Intraday Analysis 6 years, 1 month ago
Intraday analysis is a type of analysis by which the price movements of stock is predicted seeing the past price movement, the present trend and the associated volume. Its done for short term period. In case of
-
MALAY DASGUPTA wrote a new post, Technical Indicators 6 years, 1 month ago
Technical indicators are mathematical calculations based on the price, volume, or open interest of a security or contract. … Examples of common technical indicators include Relative Strength Index, Money Flow
-
MALAY DASGUPTA wrote a new post, Gap Analysis 6 years, 1 month ago
Gap Analysis is Used to identify strength of market, Rally strength. Not a directional indicator, tells if trend is moving with strength or lacks strength. Helps to locate current phase of strength, ie once manage
-
MALAY DASGUPTA wrote a new post, Candlestick Analysis 6 years, 1 month ago
candlestick is a chart that displays the high, low, opening and closing prices of a security for a specific period. The wide part of the candlestick is called the “real body” and tells investors whether the clo
-
MALAY DASGUPTA wrote a new post, Price Patterns 6 years, 1 month ago
the price patterns r very important when it comes to technical analysis there r different types of price pattern double top and bottom , head and shoulders, flag , cup, triangle patterns which r used to predict
-
MALAY DASGUPTA wrote a new post, Dow Theory 6 years, 1 month ago
Dow Theory invented by Charles H Dow. First ever concept to identify the demand & supply thru price & Volume.
Line chart if used with minimum 1 to 2 years of data and the lookup period for a particular trend -
MALAY DASGUPTA wrote a new post, Basics of Stock Analysis 6 years, 1 month ago
Fundamental analysis is a method of evaluating a security in an attempt to measure its intrinsic value, by examining related economic, financial and other qualitative and quantitative factors. technical analysis
- Load More