
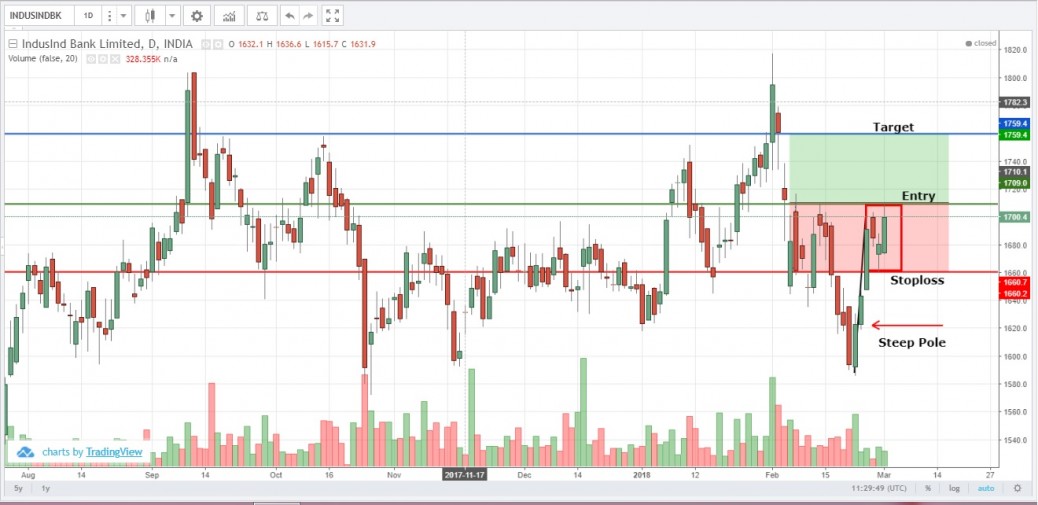
After a steep fall, a “V” shaped recovery has been noticed in the daily charts of Indusind Bank charts creating a steep pole like structure. And following few sessions have been trading within a narrow range which looks like a development of “Flag” like pattern. This seemingly flag pattern is occuring around a support zone which is a plus point. A long can been created above the high of this flag pattern with a stoploss below the flag once the breakout takes place with good volumes.


Hi sir,
your observation is good.
Hi Vignesh,
Thanks for your confirmation on my analysis..
But honestly, i’m not able to practically apply it when it comes to trading.. what i mean to say is today INDUSIND BANK broke out of its flag pattern but i could not enter the trade as it just shot up in the early morning before i could place my trade as I was waiting to see if there was some volume build up. I missed the trade just because I waited for the volume confirmation. I understand that by volume confirmation we can ensure it not a false breakout but still can there be a practical solution for this please?
Can you please throw some light on how I can be in optimum position to execute these trades? cos it would not make any sense if i just found trades but could not execute them.
Please advise me on how should my approach be when it comes to enter these kind of trades, specifically Flag patterns and Triangle Pattern.