

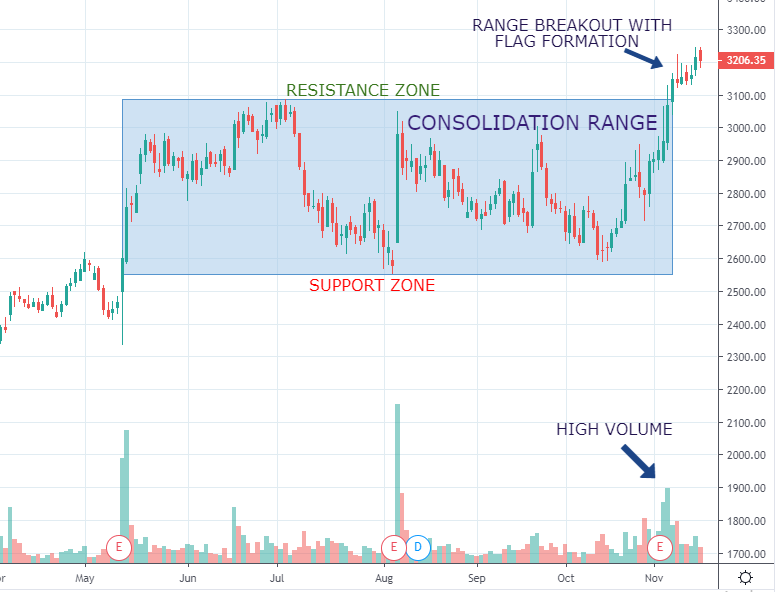
SRF creates flag above the broken resistance zone
- The stock is sitting just on top of a breached consolidation range and also moving within a bullish flag pattern
- In the weekly chart, the price breached all time highest high and headed towards the North.
- The stock chart points to the support level at 2540. The loss of previous resistance level at 3090 will open the door to the search for new relative highs.
- The stock has an evidence of a Bollinger Band expansion which indicates that a fresh rally in the cards
- The positive technical picture and the expanding volatility in the Bollinger Band mean that bullish dominance will last longer.