
@vjraja007gmail-com
-
Raja wrote a new post, TATAMOTORS – RSI – TATAMOTORS 2 years, 1 month ago
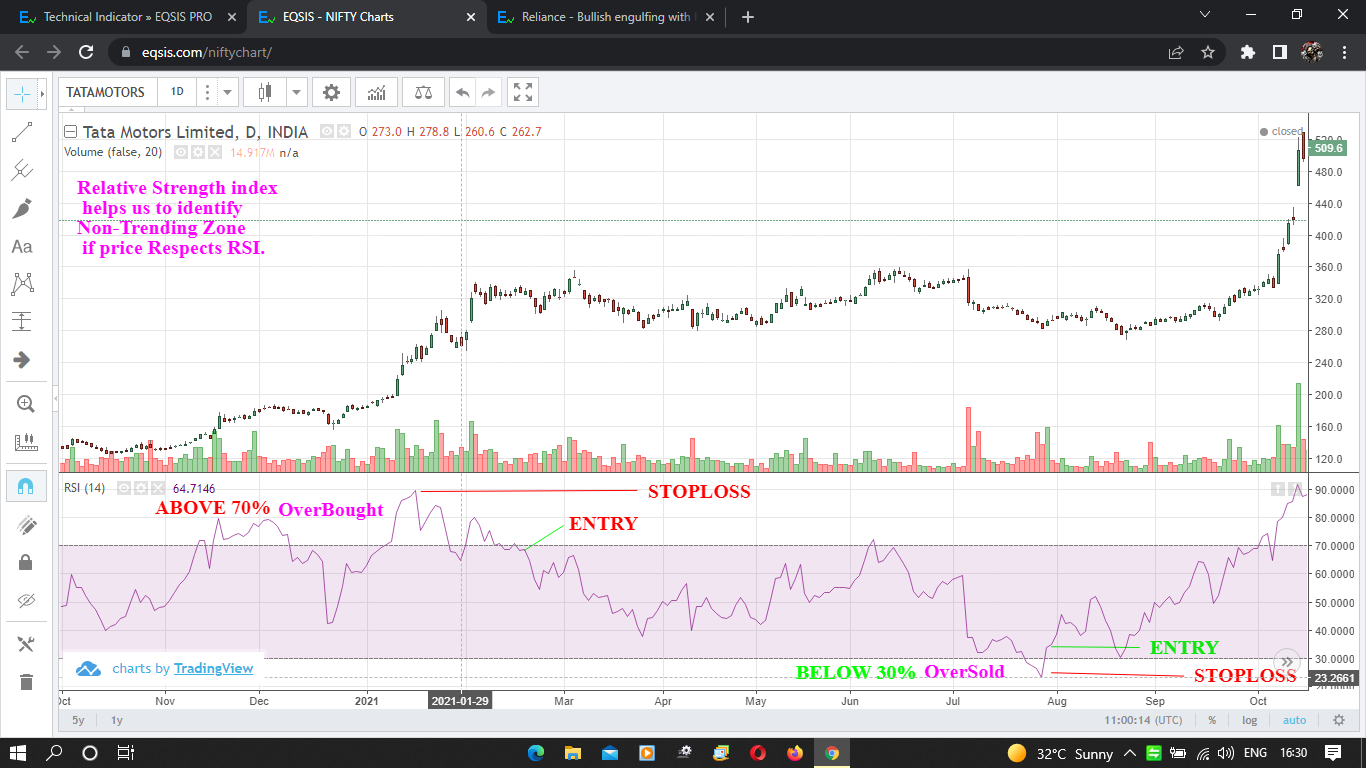
RSI is used to indicates overbought Above 70% and oversell Below 30%.
If the Difference between Price and Indicator then it is called divergence.
RSI is used to identify non-trending zone if the price respects RSI.
-
Raja wrote a new post, MOVING AVERAGE INDICATOR – AUROPHARMA 2 years, 1 month ago
Moving average is used to analysis the trend.
It is calculated by average of month or 21 days etc..,
-
Raja wrote a new post, BANKBARODA – Exhaustion Gap 2 years, 1 month ago
Witness of Exhaustion Gap.
Gap filled on same Day.
Days close is days Low.
Volume is High.
-
Raja wrote a new post, DIVISLAB – Runaway Gap 2 years, 1 month ago
witness of Runaway Gap.
The Close is Days High.
Gap is not Filled.
Volume is High.
-
Raja wrote a new post, GAIL – Breakout Gap 2 years, 1 month ago
Witness of Breakout Gap appears in trading range.
Area gap is not filled.
Volume is High.
-
Raja wrote a new post, DLF – Area Gap 2 years, 1 month ago
Witness of Area Gap appear inside the trading Range.
Area gap is filled.
Volume is Low.
-
Raja wrote a new post, AMBUJACEM – Hanging Man – BEARISH 2 years, 1 month ago
The witness of Hanging Man of Bearish its Upper Tail is two times of its Body size.
Recent Rise in Price.The Candle is red in color.The Lower tail should be Invisible or small in size.Volume is High,
-
Raja wrote a new post, GAIL – DOJI Candlestick Pattern – Morning Star -Bullish 2 years, 1 month ago
The Witness of DOJI Candlestick Pattern of Morning Star.
Recent Fall in Price.High Volume on DOJI.
-
Raja wrote a new post, BPCL – Piercing Candlestick Pattern -Bearish 2 years, 1 month ago
The Witness of Bearish Piercing Candlestick Pattern.
Recent Rise in Price.The Bearish Body covered previous day Bull Body by more than 50%.The Bearish Body covered the previous day high tail.
-
Raja wrote a new post, LT – Engulfing Candlestick Pattern -Bearish 2 years, 1 month ago
witness of Engulfing Candlestick Pattern.
Recent Rise in price.The Bearish Body covered previous day Bull Body.increase in trading volume duration of last two days.
-
Raja wrote a new post, MNM – Triangle Pattern 2 years, 1 month ago
witness of triangle pattern A-B-C-D-E.
the triangle area duration is more than 1.5 months.
volume is high.
triangle breakout around 70%.
-
Raja wrote a new post, TITAN – FLAG PATTERN – BULLISH 2 years, 1 month ago
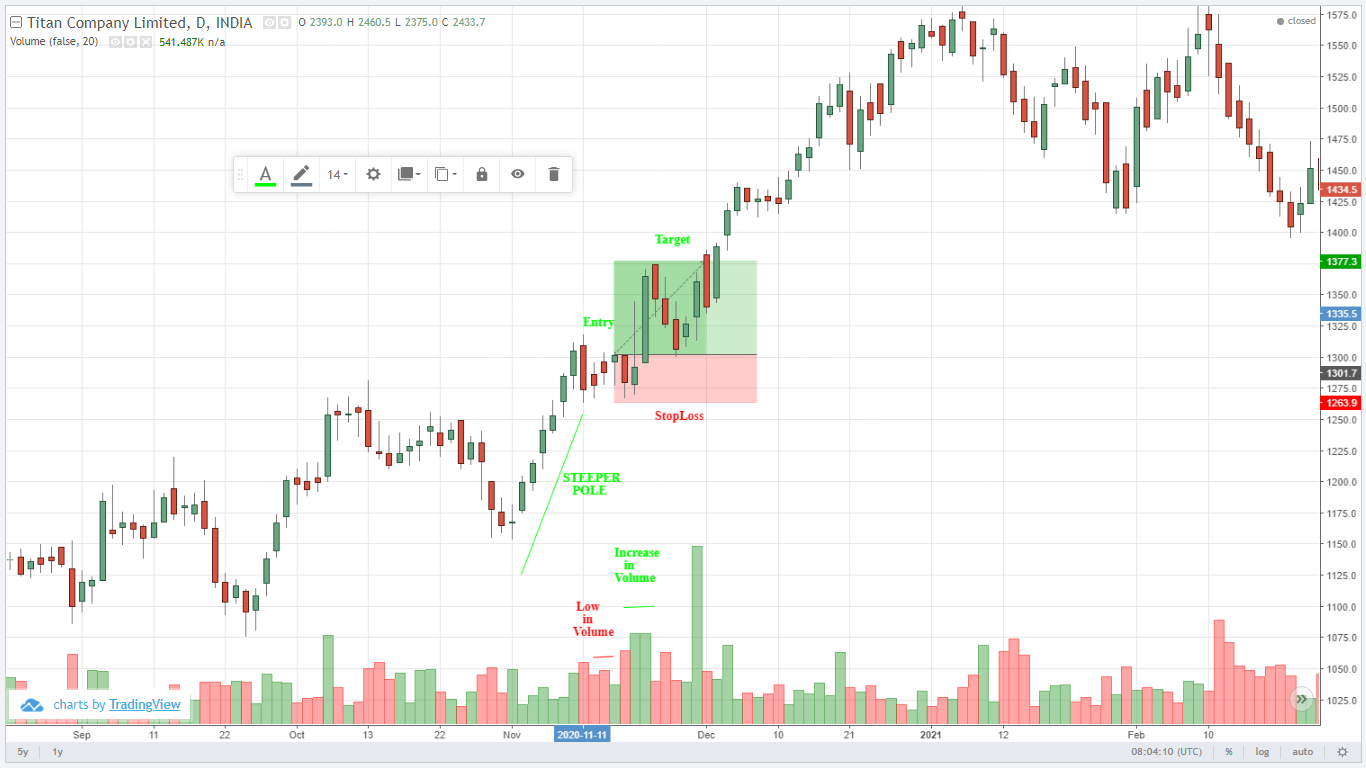
The witness of Flag Pattern.
Steeper pole is found and side ways movement of 3-4 days.pole flag breaks Positive Break out.Target is assumed as 2x length of stop loss.Volume is increased.
-
Raja wrote a new post, TATASTEEL – Cup Pattern – Bullish 2 years, 1 month ago
The witness of cup pattern.
It takes longer duration to form with Lack of Volume.
Long Position is created if it cross the Neckline or If the cup is started filled.
-
Raja wrote a new post, ULTRACEMCO – Head and Shoulder – Bearish 2 years, 1 month ago
The witness of Head and Shoulder pattern.
It has 3 months in Duration.
The pattern is Visible through Shoulder-Head-Shoulder.
Left shoulder has high duration of volume compared to Right Shoulder.
-
Raja commented on the post, Candlestick Analysis 2 years, 1 month ago
Thank you so much sir.
-
Raja wrote a new post, OFSS – DOUBLE TOP 2 years, 1 month ago
The Witness of Double Top with High volume.
The time taken to form should be min 20 days. The witness is above 20days.
Entry – 4497.
Target – 4052.
<
p style="margin: 0.85em 0px;direction: ltr;color: #77
-
Raja wrote a new post, BAJAJ-AUTO – DOUBLE BOTTOM 2 years, 1 month ago
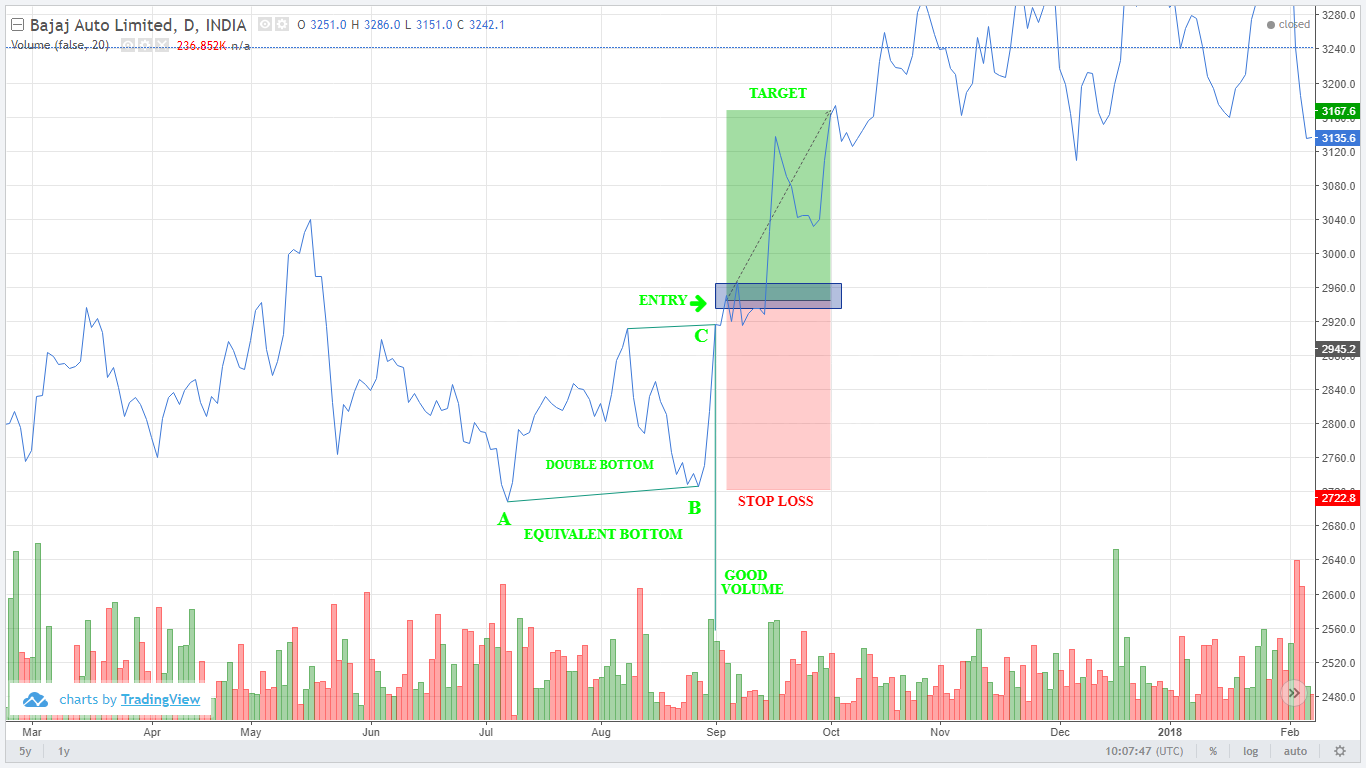
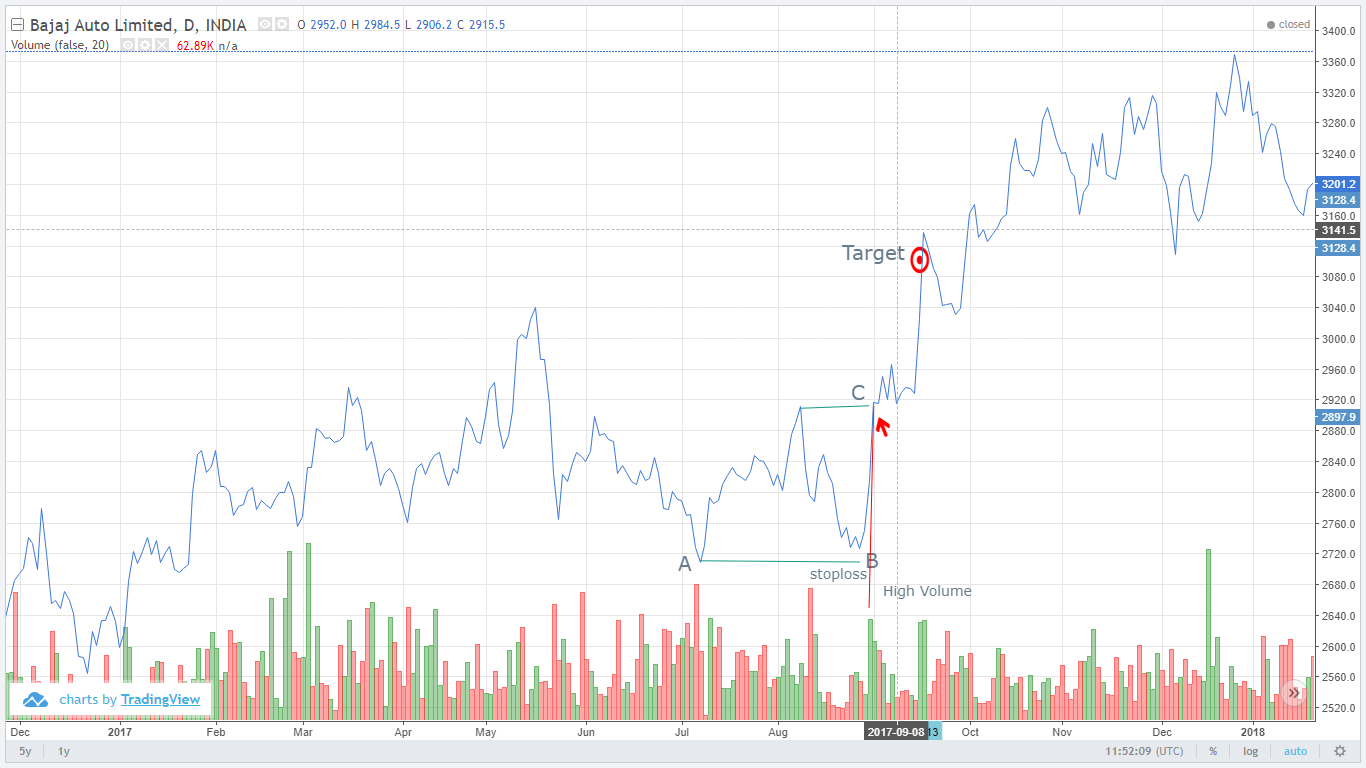
The Witness of Double Bottom and good volume.
The time taken to form should be min 20 days. The witness is above 20days.
Entry – 2944.
Target – 3167.
Stop Loss – 2726.
-
Raja wrote a new post, BAJFINANCE – Dow Theory – Bullish. 2 years, 1 month ago
The Higher Bottom – Higher Top Sequence found with High Volume.
The Long Position is Created.
Entry : 4919.
Target : 7935.
StopLoss : 1939.
The Target achieved in next 152 Days.
-
Raja wrote a new post, INTRADAY ANALYSIS 2 years, 1 month ago
Intraday means Buy or Sell with in the Day is called traders. Intraday means spot market and positional means long term trading or investors.
Intraday analysis is based on sentiments, trends, Market Directions. -
Raja wrote a new post, Technical Indicator 2 years, 1 month ago
Technical indicator is used to identify the trend, it acts as supporting tools. It can’t be used to identify the Demand and supply zones, Fibonacci is used to identify resistance and support zone.
- Load More