
@shreesh
-
Shreesh wrote a new post, cup pattern in formation 2 years, 11 months ago
hdfc has a cup pattern in formation which indicates accumulation period
the rounding period volume is also low
if the cup pattern is formed then the trade can be
-
Shreesh commented on the post, FLAG PATTERN 2 years, 11 months ago
ashok leyland formed a descending triangle pattern
-
Shreesh wrote a new post, exhaustion gap witnessed at yes bank during aug 2020 2 years, 11 months ago
it indicates the power of sellers after a bullish rally
it is also with high volume
-
Shreesh wrote a new post, runaway gap witnessed at ongc during 9th march 2020 2 years, 11 months ago
bearish runaway gap witnessed with high volume indicating strength of sellers the area gap will not be filled in near term
-
Shreesh commented on the post, Bullish Flag Pattern observed – Sanghi Idustries 2 years, 11 months ago
amazing find sir
-
Shreesh wrote a new post, flag pattern witnessed at havells during july 2018 2 years, 11 months ago
the flag pattern is formed with a stepper pole and rectangular sideways movement
it is also with high volume during the break out hence we confirm the bullish trend
entry:610
stop loss:559
target:661
risk
-
Shreesh wrote a new post, hammer pattern witnesses in piramal on 28th oct 2018 2 years, 11 months ago
since a hammer pattern is witnessed a long position is created.the hammer pattern is of good volume and the upper wick is nearly invisible .
entry 1937
stop loss 1794
target 2140
risk reward ratio 1:1.5
the
-
Shreesh wrote a new post, bearish breakout witnessed at yes bank during july 2020 2 years, 11 months ago
break out gap appears when price gives breakout from its trading range and it may not be filled in the near term.the volume is also high indicating the strength of sellers
-
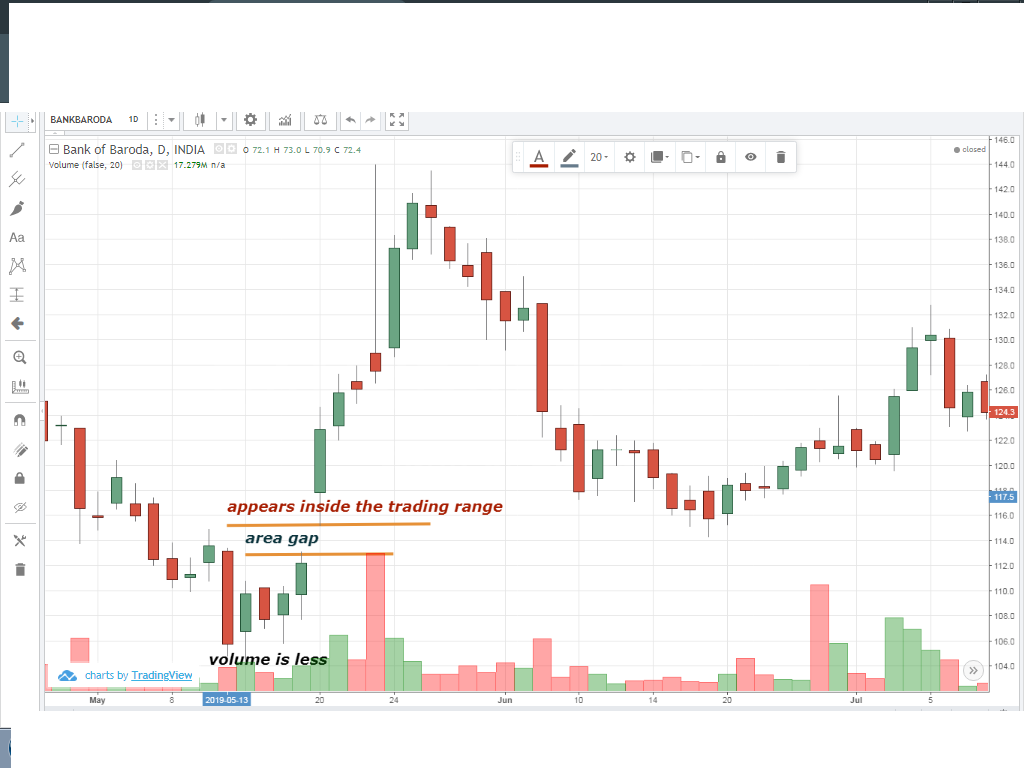
Shreesh wrote a new post, area gap witnessed in bank of baroda in may of 2019 2 years, 11 months ago
it does not indicate anything.the area gap might be filled very soon.volume is also less during the area gap day.the area gap usually forms in the trading range.
-
Shreesh commented on the post, DOJI PATTERN WITNESSED IN CONTAINER CORPORATION LIMITED INDIA IN MAY 2019 2 years, 12 months ago
the volume present on the doji day is high compared to the past five days volume
isnt that condition enough -
Shreesh wrote a new post, piercing pattern witnessed at apollo hospitals in june of 2020 2 years, 12 months ago
piercing pattern is witnessed after a significant downfall indicating buyers strength in market.
therefore long position is created because the body on the piercing pattern day starts below the previous day
-
Shreesh wrote a new post, DOJI PATTERN WITNESSED IN CONTAINER CORPORATION LIMITED INDIA IN MAY 2019 2 years, 12 months ago
Doji pattern witnessed with average volume after a significant downfall which indicates trend reversal
therefore long posistion is created
entry:478.3
stop loss:469.8
target:490
risk reward ratio- 1:1.5
stop
-
Shreesh wrote a new post, TRIANGLE PATTERN WITNESSED AT KSCL IN 2017 2 years, 12 months ago
TRIANGLE PATTERN IS FORMED AT KSCL AND THE BREAKOUT APPEARS AT THE 70 PERCENT ZONE WITH HIGH VOLUME INDICATING THE STRENGTH OF BUYERS
ENTRY :675
STOP LOSS;621
TARGET:729
THE TARGET IS NOT ACHIEVED AND WE THE
-
Shreesh wrote a new post, engulfing candle stick pattern witnessed 3 years ago
AMBUJA CEMENT
bullish engulfing pattern is witnessed in ambuja cement in the year 2019 oct month after a downfall which indicates trend reversal there fore long posistion is created
entry :193.5
stop loss:
-
Shreesh wrote a new post, double top witnessed at airtel 3 years ago
double top is witnessed at bharati airtel in 2017 with a huge volume at point c indicating a strong double top
therefore a short posistion is created
entry:483
exit:543
target:423
risk reward ratio-1:1
the
-
Shreesh commented on the post, BEL- Dow Theory 3 years ago
chart looks very complicated sir pls do try to male it simple and easy to understand
-
Shreesh wrote a new post, dabur-dow theory-bullish 3 years ago
dabur india limited
higher top higher bottom is witnessed with above average volume
therefore by dow theory,long posistion is created
entry:548
stop loss:500
target:596
risk reward ratio- 1:1
-
Shreesh and
Shoba Vinothkumar are now friends 3 years ago
-
Shreesh wrote a new post, intraday analysis 3 years ago
Intraday analysis is the method of analysis to identify the stocks that needs to be traded(bought & sold) in the same day to make income/profit. Intraday analysis is based on market sentiment, i.e, Market
-
Shreesh wrote a new post, technical indicators 3 years ago
Technical indicators are supportive tool for the technical analysis and not decision makers. It is a ready made analysis. They are mathematical calculations based on the price andvolume. It is an additional tool
- Load More