
@hemamalini
-
HemSundar wrote a new post, Honeywell atomations_Head and shoulder 4 years, 9 months ago
Since there is a Head and shoulder pattern in Honeywell , We can expect a Bullish trend reversal. Pattern identifies on 10 june 19. target achieved on 21st June.
-
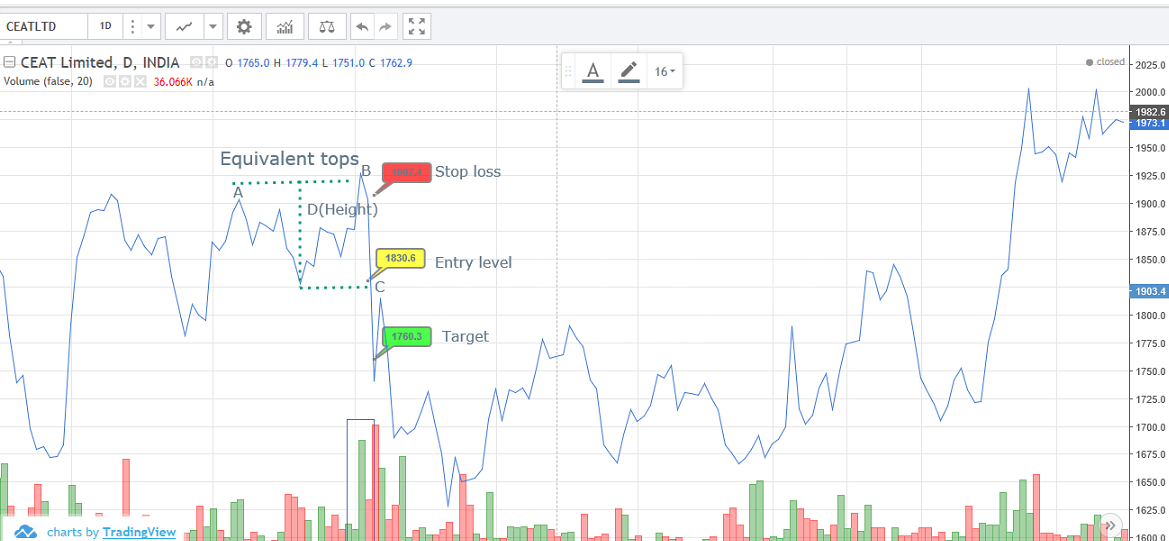
HemSundar commented on the post, Ceat _ double top 4 years, 9 months ago
HOW TO IDENTIFY THE DURATION OF THE TARGET?
-
HemSundar commented on the post, Maruti _ Double Bottom 4 years, 9 months ago
Hi naresh. thanks for your comment.
Here in this double bottom, the first bottom was on 9 th oct and the second one was on 30 th oct.
So it is more than 20 days only right? is that duration gap not enough -
HemSundar and
Yogi Ramachandran are now friends 4 years, 9 months ago
-
HemSundar commented on the post, Parag Milk Foods Ltd – Double Top – Short Position 4 years, 9 months ago
Good explanation.
-
HemSundar wrote a new post, Maruti _ Double Bottom 4 years, 9 months ago
In Maruti after a downtrend there is a double bottom with high volume at point B. SO I consider these bottoms as double bottoms and made a trade plan .Entry = 7123S.L = 6650Target = 7619( calculated As explained
-
HemSundar wrote a new post, Ceat _ double top 4 years, 9 months ago
There was a double top formation in CEATLTD as it fullfills the conditions like the duration between the tops with 20 days and higher volume in point B.So I can consider this as a double top and was able to make
-
HemSundar commented on the post, Titan_Bullish_Dow 4 years, 9 months ago
Thanks for your comments naresh. . So here in titan I can consider a long position .
-
HemSundar commented on the post, Double Top – Day 2 – Practice 4 years, 9 months ago
If it is wrong, please correct me.
-
HemSundar commented on the post, Double Top – Day 2 – Practice 4 years, 9 months ago
Hi Naresh,
pls check my attachment and let me know if my understanding is right based on your comment. -
HemSundar wrote a new post, Titan_Bullish_Dow 4 years, 9 months ago
Since I can see the High tops and bottom accompanied with higher volume i can say it as a Bullish Trend using Dw theory
-
HemSundar joined the group
 Pattern Finder 05072019 4 years, 9 months ago
 -
HemSundar commented on the post, DOW THEORY DAY-11 4 years, 9 months ago
Would like to know How you managed to find the selling price? In what basis?
-
HemSundar wrote a new post, Maruti 4 years, 9 months ago
While looking at Maruti share price, I could see lower tops and lower bottoms after july 2017. Which is accompanied with high volume and so I consider this as a bearish trend based on dow theory.
-
HemSundar wrote a new post, Candle stick 4 years, 10 months ago
Candlesticks are created by up and down movements in the price. While these price movements sometimes appear random, at other times they form patterns that traders use for analysis or trading purposes. …
-
HemSundar wrote a new post, Price patterns 4 years, 10 months ago
Price patterns are the graphs/ charts which shows the price movements of the stock in a given period of time. there are many patterns to study. Cup , double top, double bottom, Flag, Triangle are few important patters.
-
HemSundar wrote a new post, dow theory 4 years, 10 months ago
— do —
-
HemSundar wrote a new post, Basics of analysis 4 years, 10 months ago
Fundamendal analysis is analyzing a company from its past financial performance and quality of the management.
Technical anaalysis is analysing a company from its price movements and volume aand demand, supply
-
HemSundar wrote a new post, Basics of Future and options 4 years, 10 months ago
A futures contract is a legal agreement to buy or sell a particular commodity or asset at a predetermined price at a specified time in the future.
A call is a options contract that gives the buyer the right to -
HemSundar wrote a new post, Basics of trading 4 years, 10 months ago
Trading is a systematic analysis to make it a business and one need thoughtful understanding of technical analysis strategy to trade at right price and right time.
- Load More