@aisjishnu
-
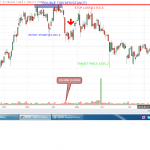
Aiswarya wrote a new post, BAJAJ AUTO makes bearish piercing on dec,2018 5 years, 1 month ago
-
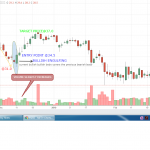
Aiswarya wrote a new post, DABUR makes BULLISH PIERCING on mar,2018 5 years, 1 month ago
-
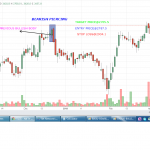
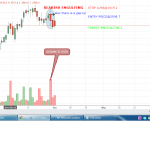
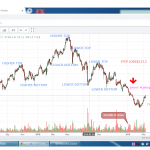
Aiswarya wrote a new post, BEARISH ENGULFING 5 years, 1 month ago
-
-
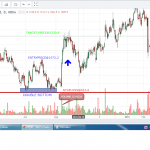
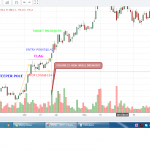
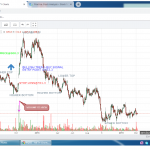
Aiswarya wrote a new post, Axis Bank-triangle bullish breakout 5 years, 1 month ago

-
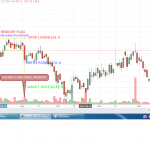
Aiswarya wrote a new post, Castrol India ltd makes bearish flag on sep,2018 5 years, 1 month ago
-
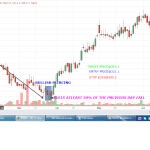
Aiswarya wrote a new post, Bank of Baroda makes flag pattern on mar,2014 5 years, 1 month ago
-
-
-
-
-
-
-
Aiswarya wrote a new post, ASHOK LEYLAND BEARISH TREND 5 years, 1 month ago
-
Aiswarya wrote a new post, Bharti Airtel-bullish trend 5 years, 2 months ago
-
Aiswarya wrote a new post, Intraday analysis-intensive,risky but pottentially profitable… 5 years, 2 months ago
Intraday analysis:
it is a top down approach with all the factors considering advance/decline ratio,index wise contribution,stock overall performance,FII activity,performance in global as well as in indian market etc., -
Aiswarya wrote a new post, technical indicators 5 years, 2 months ago
Technical indicators:Technical indicators are a fundamental part of technical analysis and are typically plotted on the chart to predict the market trend.
some of the technical indicators are
Moving -
Aiswarya wrote a new post, strategies of Gap analysis 5 years, 2 months ago
Gap analysis:Gaps are areas on a chart where the price of a stock (or another financial instrument) moves sharply up or down, with little or no trading in between happened…
there are four types of gap:
area -
Aiswarya commented on the post, candle stick analysis 5 years, 2 months ago
Thank you…hope I will continue with the same work….
-
Aiswarya wrote a new post, candle stick analysis 5 years, 2 months ago
a candlestick pattern is a movement in prices shown graphically on a candlestick chart from which we can predict a particular market movement..it is initially originated from japan traders…
Candlesticks build - Load More