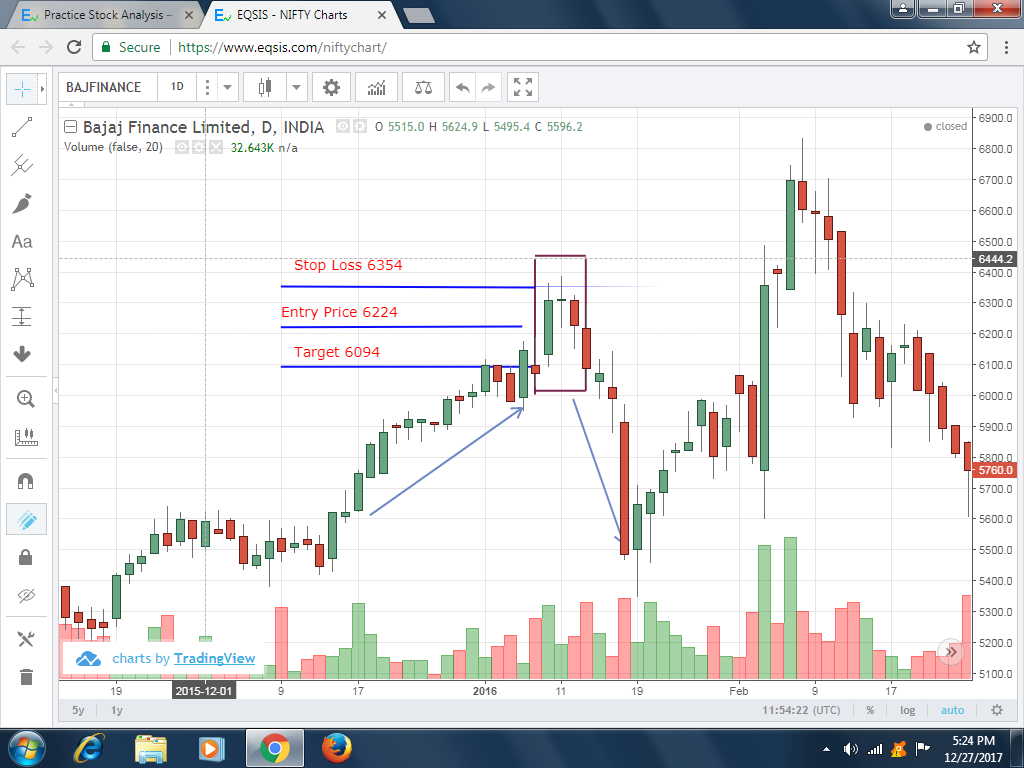
In this Bajaj Finance chart an Evening doji star formation found. In Evening doji star candle pattern formation the first day is a green candle body, the second day should open with upside gap and end as a doji day, the third day should be a red body open with down side gap and end within the first day’s body. In this Bajaj Finance chart a doji (Evening Star) appeared after a green candle. After that a red candle appeared in gap down. It is a trend reversal pattern. so before appearing the doji the trend is bullish. After the doji the trend is reversed. So this is confirmed as a Doji Evening Star. The target achieved in the same day (Intraday).
Bajaj Finance – Doji Evening Star
feel free to call us +919500077790 info@eqsis.com
Stock Analysis
M | T | W | T | F | S | S |
---|---|---|---|---|---|---|
1 | 2 | 3 | 4 | 5 | ||
6 | 7 | 8 | 9 | 10 | 11 | 12 |
13 | 14 | 15 | 16 | 17 | 18 | 19 |
20 | 21 | 22 | 23 | 24 | 25 | 26 |
27 | 28 | 29 | 30 | 31 |
Bullish View
Bearish View
- Bearish-GAP-SHORT-BICON-25-10-2019 October 25, 2019
- FEDERAL BANK – BEARISH ENGULFING October 17, 2019
- Cummins India – Bearish Engulfing – 24Sep19 September 25, 2019
- Day29-Tata Motors DVR – Bearish Piercing – 12Sep19 September 12, 2019
- Day27-Bearish-Engulfing pattern-Tech Mahindtra-09Sep19 September 10, 2019
How this forum help stock traders?
Stock Trading is business, the success depends not just on capital or subscribing advisory services or participating workshops. The factors such as your awareness level about business, Efforts and your contributions, Smartness, Knowledge in analysis and trading instrument, availability of infrastructure and emotional control determine your success.
Hi sir,
The volume should be high during the DOJI day to confirm the trend reversal.