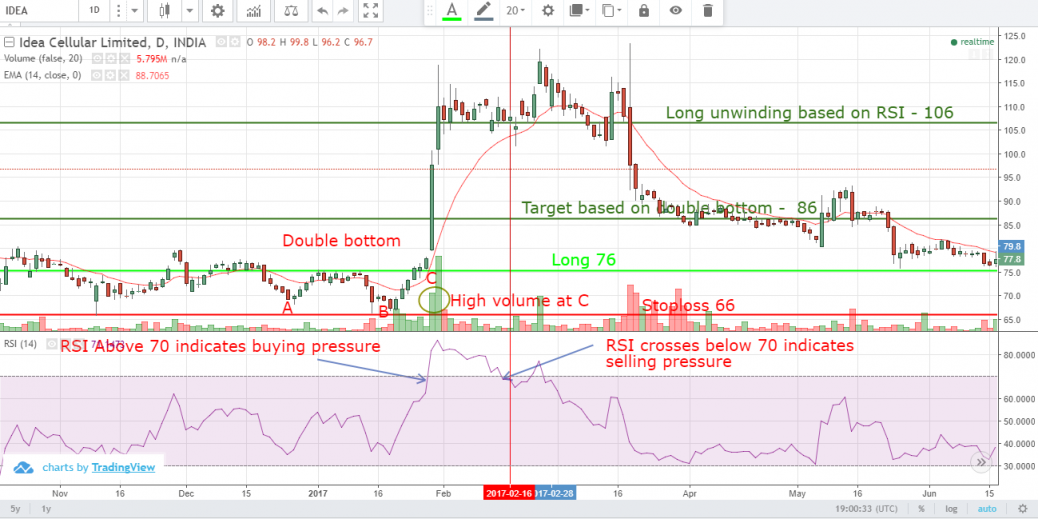
RSI in IDEA is used together with double bottom. It increases the profit in this case. RSI above 70 is crossed during the formation of double bottom. Duration of double bottom is one month.Doublebottom is a sideways movement and a RSI above 70 during this phase indicate more buying pressure which is confirmed by increase in volume at C in double bottom.
IDEA – RSI with double bottom
feel free to call us +919500077790 info@eqsis.com
0 Comments
Stock Analysis
M | T | W | T | F | S | S |
---|---|---|---|---|---|---|
1 | 2 | 3 | 4 | 5 | ||
6 | 7 | 8 | 9 | 10 | 11 | 12 |
13 | 14 | 15 | 16 | 17 | 18 | 19 |
20 | 21 | 22 | 23 | 24 | 25 | 26 |
27 | 28 | 29 | 30 | 31 |
Bullish View
Bearish View
- Bearish-GAP-SHORT-BICON-25-10-2019 October 25, 2019
- FEDERAL BANK – BEARISH ENGULFING October 17, 2019
- Cummins India – Bearish Engulfing – 24Sep19 September 25, 2019
- Day29-Tata Motors DVR – Bearish Piercing – 12Sep19 September 12, 2019
- Day27-Bearish-Engulfing pattern-Tech Mahindtra-09Sep19 September 10, 2019
How this forum help stock traders?
Stock Trading is business, the success depends not just on capital or subscribing advisory services or participating workshops. The factors such as your awareness level about business, Efforts and your contributions, Smartness, Knowledge in analysis and trading instrument, availability of infrastructure and emotional control determine your success.