
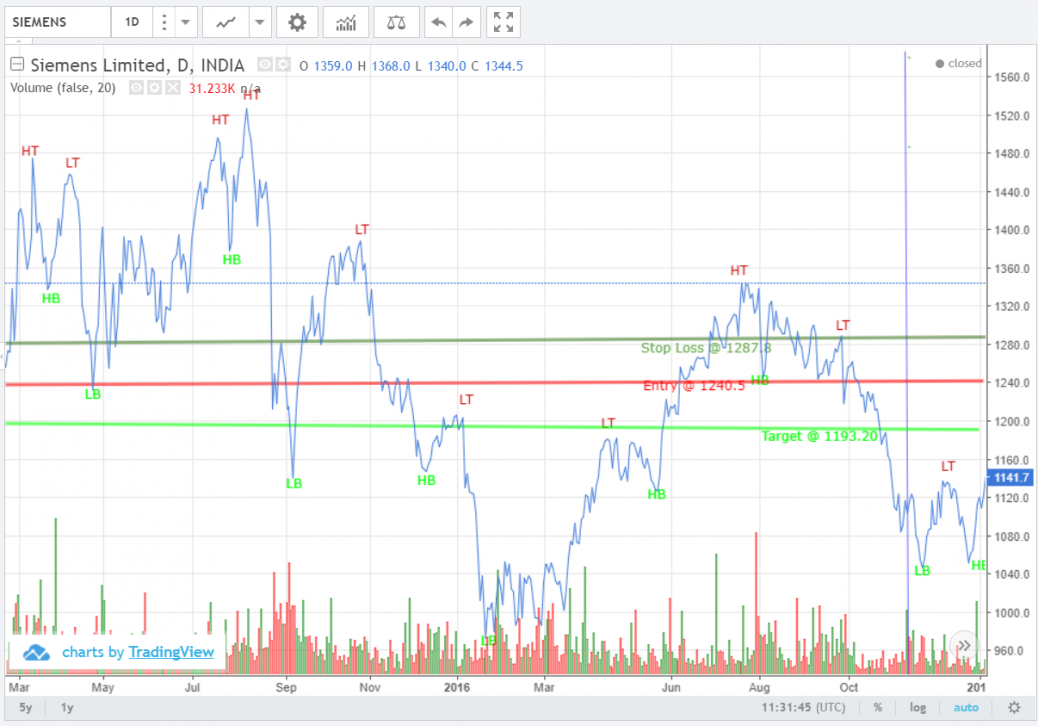
SIEMENS -Dow – Bearish view.
Fix the line chart for 2 years period ( min) & start defining the chart into HT, LT, HB, & LB, then find for LT-LB combination. If the trend crosses the previous higher bottom with a high volume, then a short position can be created. Stop Loss @ LT point & Target is subtract the difference between ( Entry – Stop loss)


Good effort,
One suggestion: Marking are fine, but still there is a way to avoid some of the minor markings
Noted Sir., will be avoided in my future charts.,