
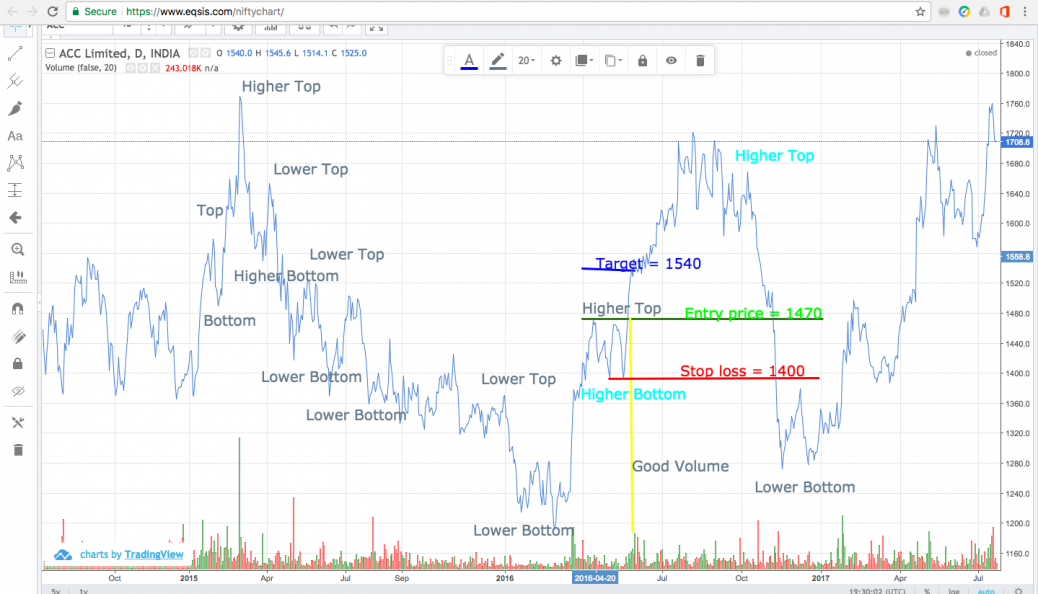
The prior trend is a bearish trend. The trend found out is Higher bottom to Higher top along with good volume. Hence the stock can be bought(Entry price) at the point where it breaks the previous top. Expected trend is bullish at this point.
feel free to call us +919500077790 info@eqsis.com
The prior trend is a bearish trend. The trend found out is Higher bottom to Higher top along with good volume. Hence the stock can be bought(Entry price) at the point where it breaks the previous top. Expected trend is bullish at this point.
| M | T | W | T | F | S | S |
|---|---|---|---|---|---|---|
| 1 | 2 | 3 | 4 | 5 | 6 | 7 |
| 8 | 9 | 10 | 11 | 12 | 13 | 14 |
| 15 | 16 | 17 | 18 | 19 | 20 | 21 |
| 22 | 23 | 24 | 25 | 26 | 27 | 28 |
| 29 | 30 | |||||
 Bearish-GAP-SHORT-BICON-25-10-2019 October 25, 2019
 FEDERAL BANK – BEARISH ENGULFING October 17, 2019
 Cummins India – Bearish Engulfing – 24Sep19 September 25, 2019
 Day29-Tata Motors DVR – Bearish Piercing – 12Sep19 September 12, 2019
 Day27-Bearish-Engulfing pattern-Tech Mahindtra-09Sep19 September 10, 2019
Stock Trading is business, the success depends not just on capital or subscribing advisory services or participating workshops. The factors such as your awareness level about business, Efforts and your contributions, Smartness, Knowledge in analysis and trading instrument, availability of infrastructure and emotional control determine your success.
EQSIS, A Stock Market Research Firm
Knowledge is Power. Here you may start from basics, get support while practicing and evolve as active analyst, later you can become a pro


Good attempt, i suggest HT instead of Higher Top (it consumes too much of space).
I see the scope to improve, Kindly mark all (major) top and bottom , then qualify them as higher of lower, Later find the marking